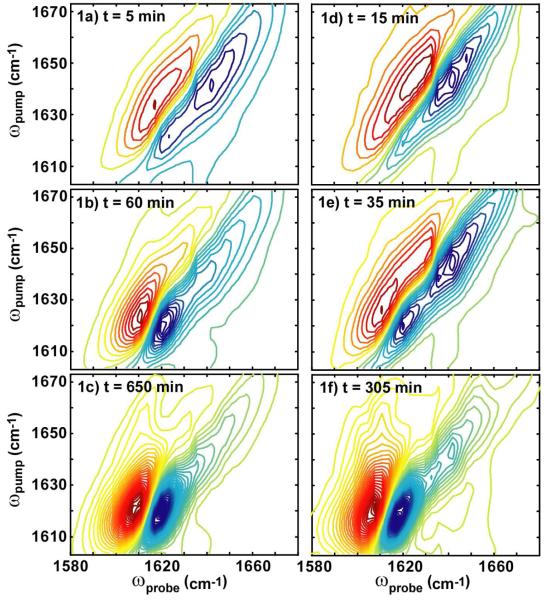
Figure 1.
(a-c) Representative 2D IR spectra at folding time t = 5 minutes, 60 minutes and 650 minutes during uncatalyzed aggregation and (d-f) three spectra at folding times t = 15, 35 and 305 minutes during lipid vesicle (7: 3 DOPC/DOPA) catalyzed aggregation. Lipid vesicles were added at t = 14 min. Red contours are positive and correspond to the same intensity interval in all spectra.

