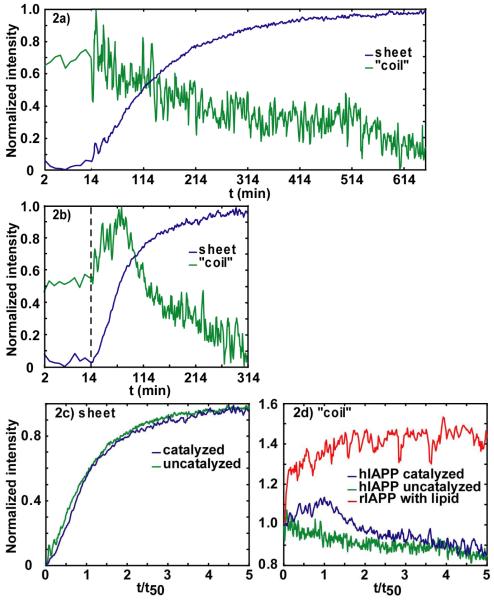
Figure 2.
Intensities in anti-symmetric β-sheet and “random coil” regions versus aggregation time for (a) uncatalyzed and (b) membrane-catalyzed hIAPP folding. The dashed line indicates at t=14 minutes lipid vesicles were added. Intensities are normalized to minimum and maximum of individual kinetic traces. (c) Normalized intensities of anti-symmetric β-sheet feature for uncatalyzed (green) and catalyzed (blue). (d) Intensities in “random coil” region (1642 cm-1), for the (green) uncatalyzed, (blue) catalyzed hIAPP experiment and (red) rIAPP experiment. Intensities are normalized to starting values at t= 0.

