
Figure 2.
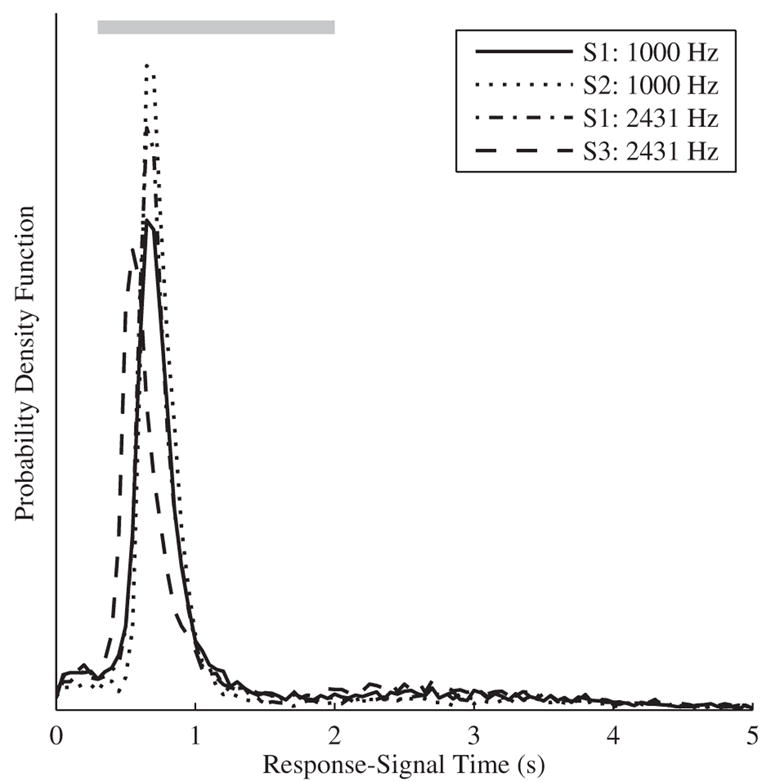
The probability density functions of the time difference between the responses and the onset of the nearest preceding signal for the three subjects and two conditions are shown. The gray shaded region at the top of the figure represents the ultimately chosen classification window. Signals which have at least one response within this window are classified as hits and responses that occur after this window are classified as false alarms.