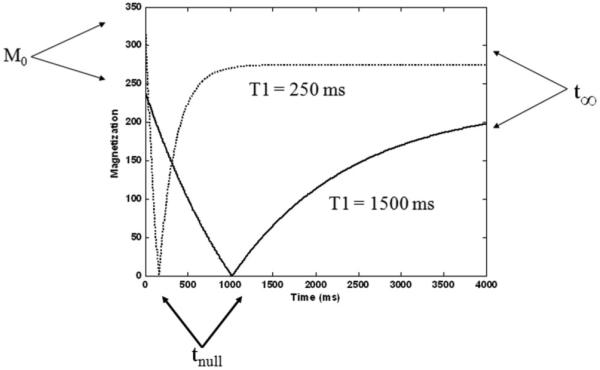
Figure 1.

T1 relaxation curves shows the three-point estimation parameters used for estimating the fit of the longitudinal relaxation signal equation. Note that for long T1 species, the approximation that the last acquired data point corresponds to t = ∞ breaks down.
