
Figure 4.
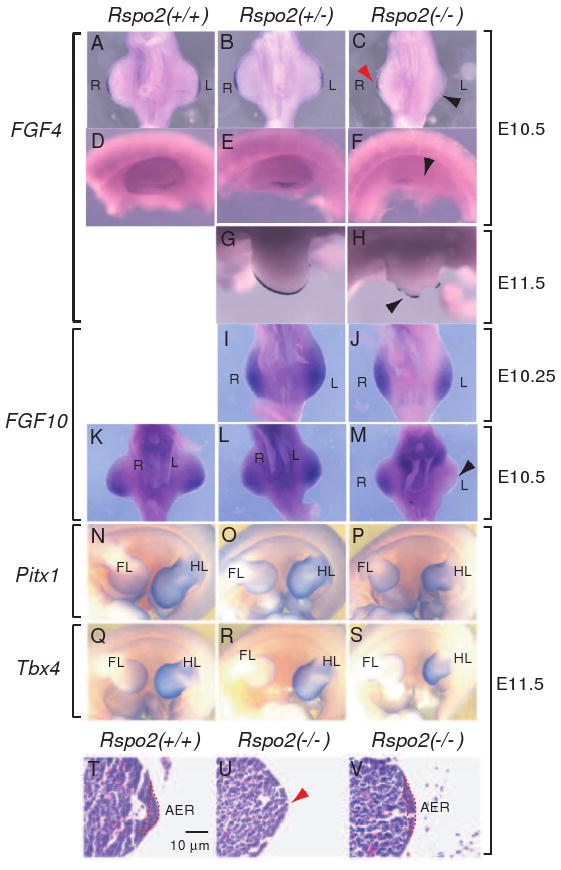
Gene expression in the developing limbs of Rspo2(-/-) mouse embryos. (A-H) FGF4 expression was analyzed by whole mount in situ hybridization in Rspo2(+/+), Rspo2(+/-), and Rspo2(-/-) embryos at E10.5 (A-F) and E11.5 (G-H). (I-M) FGF10 RNA expression was analyzed in Rspo2(+/+), Rspo2(+/-), and Rspo2(-/-) mouse embryos at E10.25 (I-J) and E10.5 (K-M), respectively. The ventral side (A-C and I-M) and left side views (D-H) of the hindlimbs are presented, respectively. The right (R) and left (L) limbs are indicated. Black and red arrowheads indicate the reduced FGF4 (C and H) and FGF10 (M) expression in the hindlimbs of Rspo2(-/-) mouse embryos. (N-S) RNA expression of the hindlimb-specific markers, Pitx1 (N-P) and Tbx4 (Q-S), in the left hindlimbs of E11.5 mouse embryos. The left side views are presented. The forelimbs (FL) and hindlimbs (HL) of mouse embryos are indicated. (T-V) Transverse paraffin sections of the hindlimbs stained with hematoxylin and eosin. The AER is outlined with a red dotted line. Red arrowhead in panel U indicates the absence of a discernable AER structure.