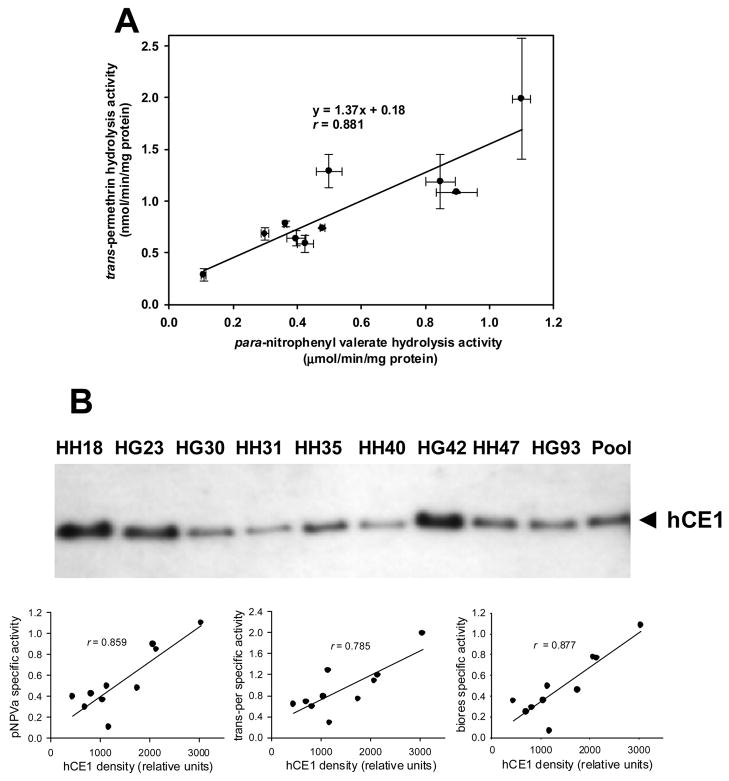
Fig. 4.
Hydrolysis of ester substrates catalyzed by individual human liver cytosols. A, Correlation of rates of para-nitrophenyl valerate hydrolysis and trans-permethrin hydrolysis catalyzed by individual human liver cytosols. Symbols are mean values and error bars are S.D. (n = 3 replicates). B, Immunoblot of individual human liver cytosols. The membranes were probed using an anti-hCE1 antibody. The density of the hCE1 immunoreactive band in each cytosolic sample was plotted against the pNPV, trans-permethrin, and bioresmethrin hydrolysis activities.

