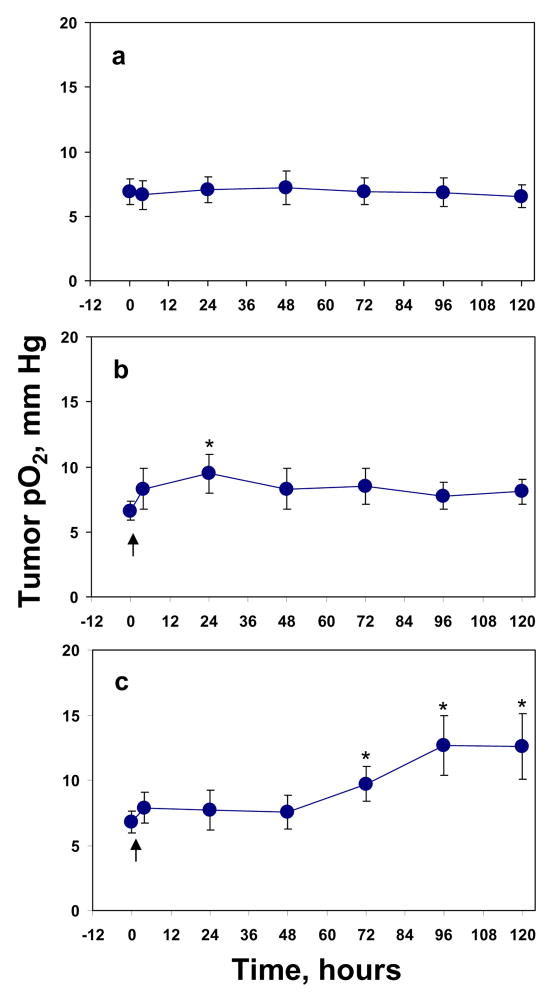
Figure 1.
The change in average RIF-1 tumor pO2 before and after a single or fractionated radiation. (a) 0 Gy, n = 18, (b) 10 Gy, n = 24–32, (c) 20 Gy, n = 18. n is the total number of EPR probes in the tumors. Arrows indicate the time of irradiation. * p < 0.05, compared with baseline tumor pO2 in the same group.

