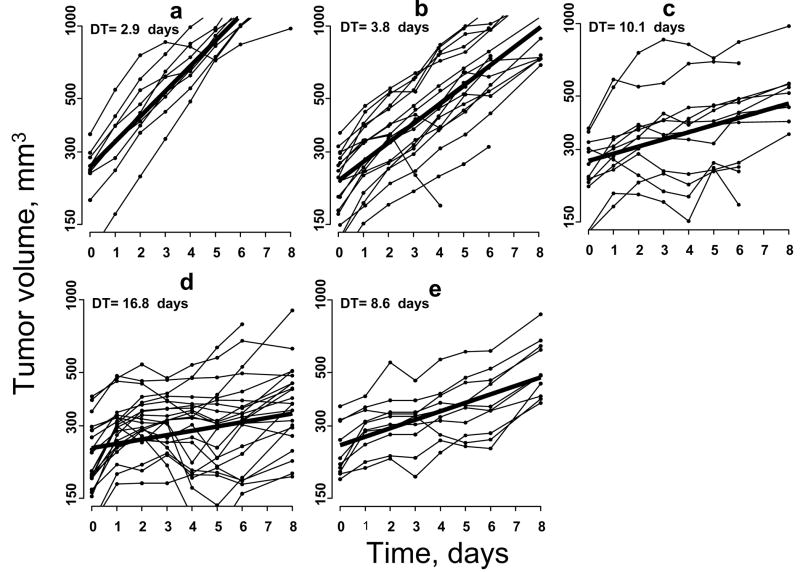
Figure 3.
The change in RIF-1 tumor volume in (a) 0 Gy, N = 9, (b) 10 Gy, N = 16, (c) 20 Gy, N = 9, (d) 10 Gy + 10 Gy at 0/24 hr, N = 24, (e) 10 Gy +10 Gy at 0/48 hr, N = 10. N is the number of animals with RIF-1 tumors in each group. Bold line indicates the mean tumor volume. Exponential mixed modeling is used to determine the DT (23, 24).

