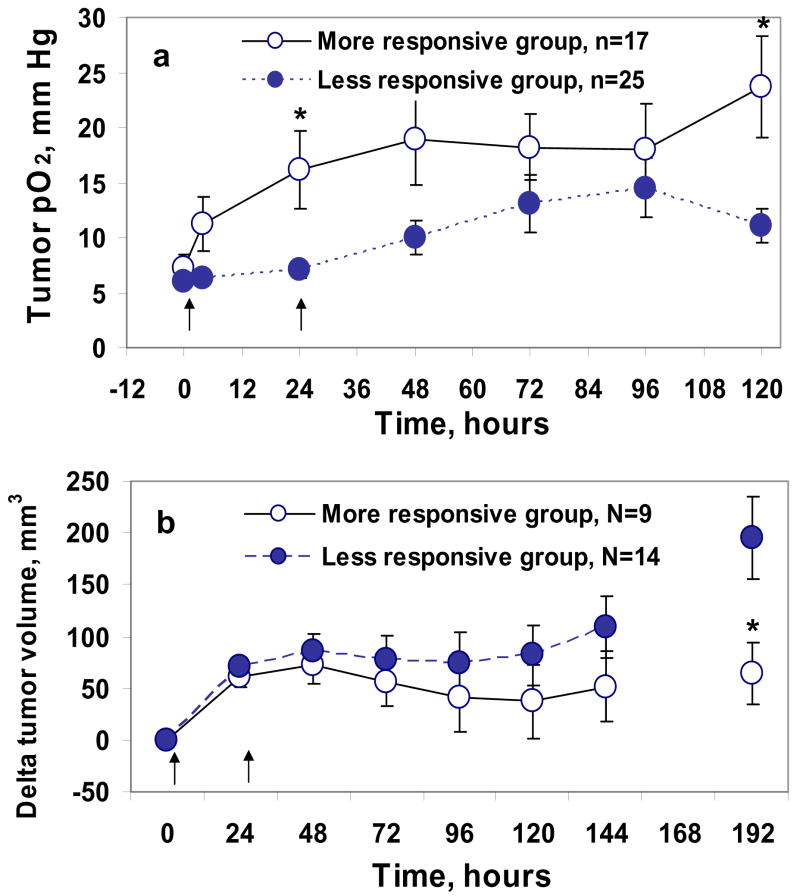
Figure 4.
Tumor pO2 (a) and tumor growth inhibition (b) of RIF-1 tumors before and after 10 Gy × 2 radiations. The interval between the doses is determined by the time course of changes in mean tumor pO2 as described in the results section. Treatment groups were: (•) less responsive group (tumor pO2 < 50 % of baseline), (○) more responsive group (tumor pO2 ≥ 50 % of baseline). * p < 0.05, compared with less responsive group (unpaired t-test). n is the number of LiPc implants in each group, N is the number of animals in each group.

