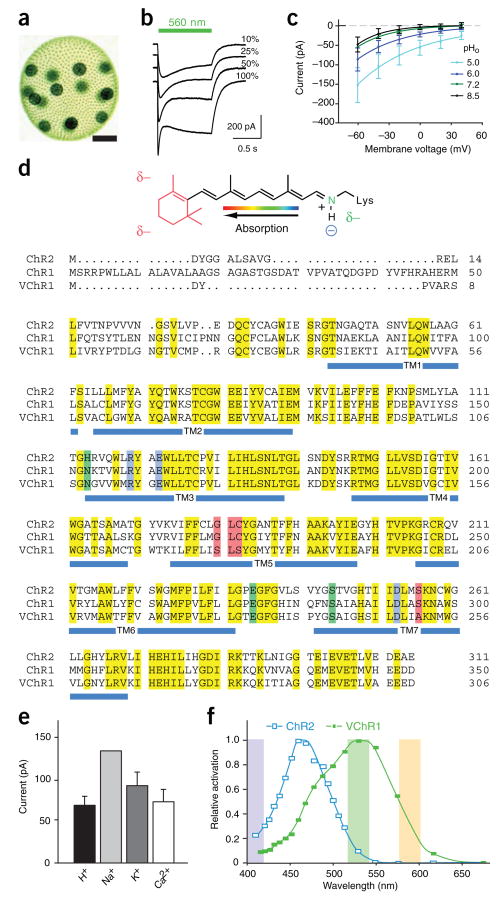
Figure 1.
Identification and characterization of VChR1. (a) Volvox carteri colony showing several thousand small somatic cells and 16 gonidia (scale bar, 125 μm). (b) Photocurrents in VChR1-expressing HEK293 cells under varying light intensity (traces represent averages of six recordings). (c) I-V relationship in HEK293 cells under varying extracellular pH. External and internal [Na+] were held constant at 140 mM. (d) RSB structure shows the predicted changes in environmental polarity as partial charges (δ–; top). Sequence comparison of ChR2, ChR1 and VChR1 is shown with residues highlighted that are predicted to define the RSB Schiff base counterion (blue), modulate electrical potential of the RSB binding pocket (red) or modulate RSB potential via long-range coupling (green). (e) Ion flux characteristics of VChR1 in HEK293 cells (n = 4; see Supplementary Methods). (f) Action spectra for VChR1 and ChR2 in oocytes; wavelengths used in later figures are shaded. Values are mean ± s.e.m.

