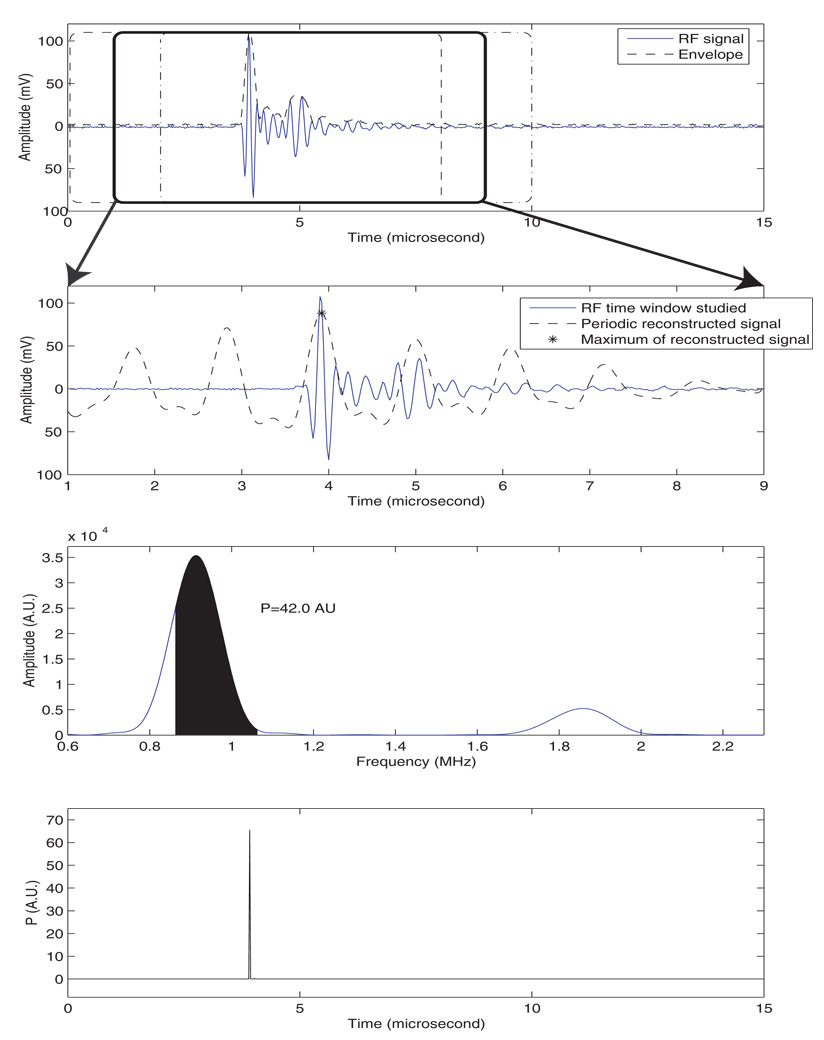
FIG. 4.
Illustration of the proposed SSA method. a) RF signal, envelope, and three 8-µs windows with 7-µs overlap (i.e., 87.5 %). b) Reconstructed signal from the SSA method. c) Spectrum of the reconstructed signal, and illustration of the evaluation of Eq. (5). d) P-line.

