
Figure 4. RuRed-and Ru360-dependent changes in calcium signalling in intact and permeabilized cells.
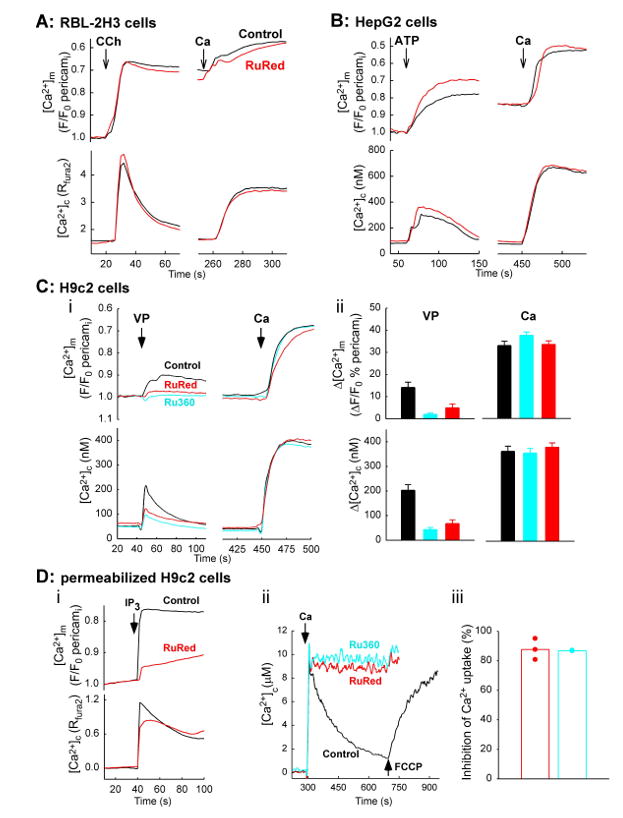
Cells cultures were transfected with mitochondria targeted inverse pericam (24h) and subsequently, pretreated with RuRed (Fluka, ≥ 85% purity, red) or Ru360 (Calbiochem, cyan) for 12-18h in serum-free medium: RBL-2H3, RuRed 5μM (A); HepG2, RuRed 10μM (B); H9c2, RuRed or Ru360 10μM each. Subsequently, cells were loaded with fura2/AM and incubated in a Ca2+ free extracellular medium. For the RuRed/Ru360 treated cells the drug was also present during the fura2 loading and the recording. Fluorescence [Ca2+]c and [Ca2+]m imaging was carried out as described before [3, 20]. Traces represent the means for 3-7 experiments for each condition.
(A) The RBL-2H3 cells were co-transfected with pericam and M1 muscarinic receptor. Cells were treated with carbachol, CCH of 100μM, thapsigargin, Tg of 2μM and CaCl2, Ca of 2mM as indicated by the arrows.
(B) HepG2 cells were treated with ATP 100μM, Tg of 2μM and CaCl2 of 5mM.
(C) H9c2 cells were treated with vasopressin, VP of 100nM, Tg of 2μM and CaCl2 of 10mM (i). Bar charts show the size of the VP- and Ca-induced [Ca2+]m and [Ca2+]m rise calculated in single cells (ii). The rates for the Ca-induced [Ca2+]c rise were 31.3±4.1 nM/s; 29.4±2.7 nM/s; 23.6±4 nM/s and for the [Ca2+]m rise were 2.4±0.4 %/s; 2.6±0.5 %/s; 2.6±0.3 %/s in control, RuRed-and Ru360-pretreated cells, respectively (n=34, 30 and 32 cells).
(D) RuRed-and Ru360 induced suppression of the mitochondrial Ca2+ uptake in permeabilized H9c2 cells
(i) Pericam-transfected adherent H9c2 cells were permeabilized with saponin and incubated in an intracellular medium containing fura2 5μM. [Ca2+]c and [Ca2+]m were followed in single cells with CCD imaging of fura2 and pericam fluorescence, respectively. To evoke a Ca2+ release from the ER IP3 7.5μM was added. RuRed of 5μM was added 3min before IP3 (red trace). Traces are means of three experiments.
(ii,iii) Suspensions of H9c2 cells (1mg protein/ml) were incubated in an intracellular medium and were permeabilized by digitonin. [Ca2+]c was monitored in a fluorometer using fura2FF (0.5μM) added to the bathing medium. CaCl2 30μM and FCCP of 5μM was added as indicated by the arrows. RuRed (red) and Ru360 (blue) 1μM each was added 1min before Ca2+ addition. Representative traces for the fluorometer records (ii) and bar charts showing the RuRed/Ru360 sensitive fraction of the decay in [Ca2+]c (iii).