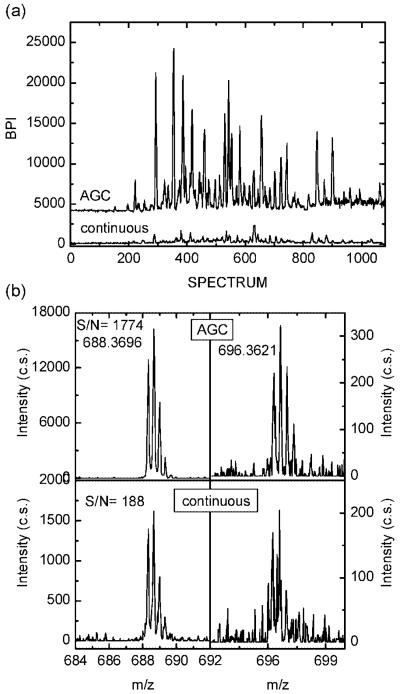
Figure 5.
(a) Base peak intensity (BPI) for the RPLC separation of 0.05 μg/μL S. oneidensis tryptic digest in the AGC-trapping and continuous modes. Note that the trace for the AGC-trapping mode is offset for clarity. (b) Segments of mass spectra for KKQEDVGSIQFANDSAVVK (m/z 688.3696) and DFNEALVHQVVVAYAANAR (m/z 696.3621) peptides from RPLC–MS of 0.05 μg/μL S. oneidensis tryptic digest in the AGC-trapping and continuous modes.

