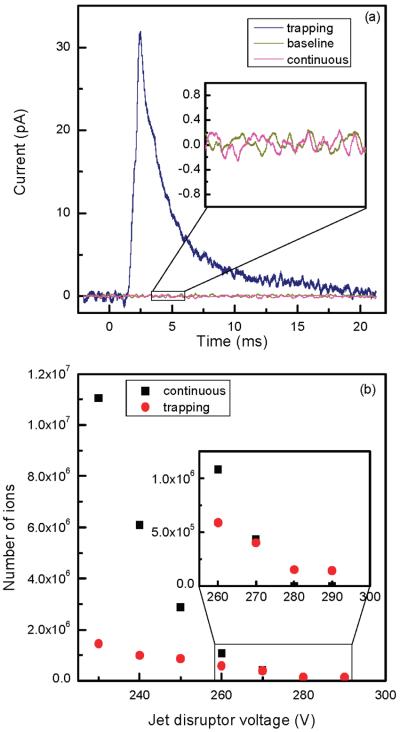
Figure 8.
(a) Representative signals in the continuous and trapping modes (756 ms accumulation time) corresponding to a jet disruptor voltage of 290 V. The inset indicates efficient ion beam throttling. (b) Total number of ions from ESI of 1 μM neurotensin solution impinging at the Faraday cup charge collector in the continuous and trapping modes as a function of jet disruptor voltage. The number of ions in the trapping mode was calculated by integrating the area under the ion pulse (such as the one shown in panel a) while in the continuous mode the charges were calculated over a time equal to the trap accumulation time. The inset depicts data at jet disruptor voltages of 260–290 V.

