Fig. 5.
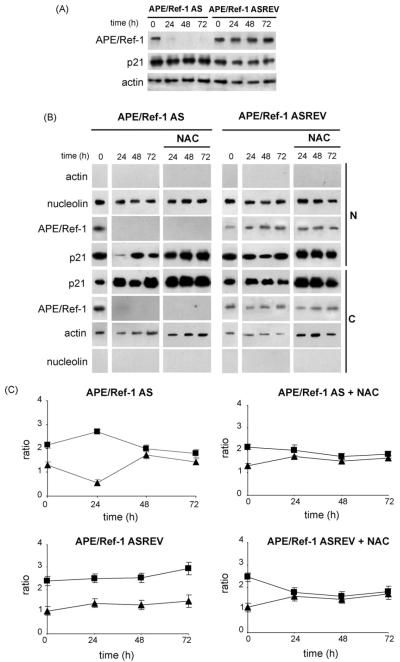
Analysis of p21 expression in B cells transfected with APE/Ref-1 AS and control oligonucleotides (A) Western blot analysis using anti-APE/Ref-1 Ab (upper panel) anti-p21 (middle panel) and actin (lower panel) on equal amount of total extracts prepared from primary mouse B cells stimulated with anti-CD40 mAb for 24, 48 and 72 h and pre-treated with APE/Ref-1 AS or control (APE/Ref-1 ASREV) oligonucleotides. Representative blots from one of three independent experiments are shown. (B) Nuclear (N) and cytoplasmic (C) proteins were prepared from activated B cells transfected with APE/Ref-1 AS or control (APE/Ref-1 ASREV) and treated with or without NAC, harvested at the indicated times and analyzed by SDS-PAGE and Western blot for p21 protein. Nucleolin and actin were assayed as controls for the purity of the nuclear and cytosolic fractionation. Results are representative of at least three independent experiments. (C) Densitometric scanning of bands is reported as ratio between the p21 protein levels and the actin or nucleolin levels in the same sample using MultiAnalyst program. Bars indicate the means±S.D. of three independent experiments. (■) indicates cytoplasmic values and (▲) nuclear values in cells activated by CD40 cross-linking.

