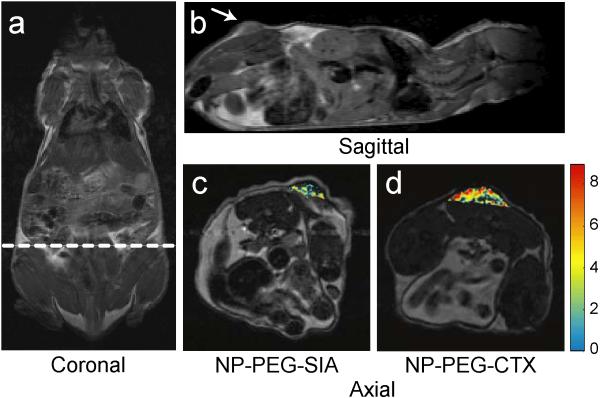
Figure 6.
Representative images from three independent experiments with similar results. MRI anatomical image of a mouse in the (a) coronal plane with the dotted line displaying the approximate location of the axial cross sections displayed in (c) and (d). Anatomical image in the (b) sagittal plane displaying the location of the 9L xenograft tumor. Change in R2 relaxivity values for the tumor regions (superimposed over anatomical MR images) for mouse receiving (c) non-targeting NP-PEG-SIA and (d) NP-PEG-CTX 3 hrs post injection. The white arrow in (b) marks the tumor location.

