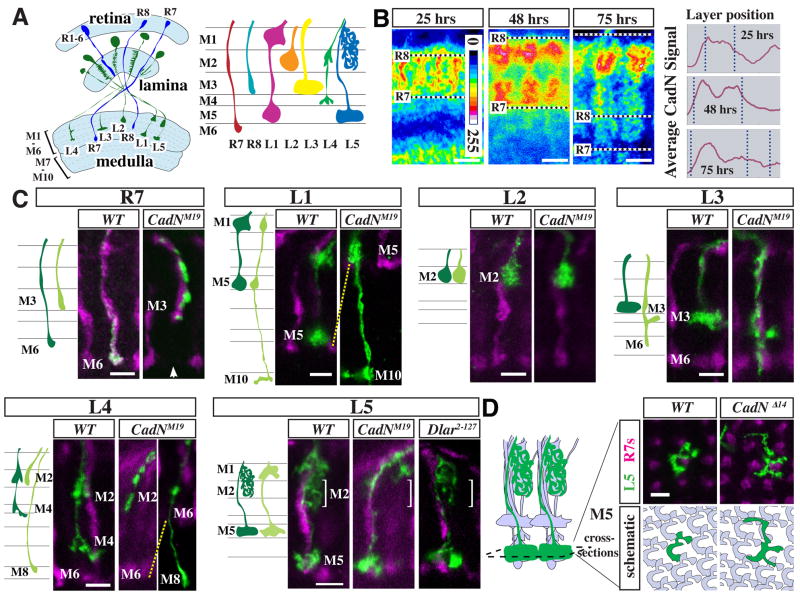
Figure 1. CadN requirements for lamina neuron targeting.
(A) Schematic of R cell (blue) and lamina neuron (green) projections in the adult visual system. Left panel, light blue areas mark the retina and the neuropils of lamina and medulla. Right panel, R cell and lamina neuron terminals in the outer six layers of the medulla. (B) CadN distribution in the developing medulla. Single confocal sections of CadN protein staining (mAb DN-Ex#8) at indicated times after puparium formation (APF) are shown in pseudocolor (see included scale for values). Graphs show layer distribution of the anti-CadN staining intensity (y-scale shown is 0–200) averaged over five adjacent columns. Dotted lines mark corresponding layer positions in confocal images and graphs. Positions of R8 and R7 growth cones are indicated. Scale bars, 5 μm. (C) Single cell CadN mutant phenotypes of L1–L5 and, for comparison, R7. Schematics and confocal images show medulla terminals of wild-type (dark green in cartoon) and CadNM19 mutant (light green) neurons of the indicated cell types. L1–L5 and R7 MARCM clones (anti-GFP staining, green) were generated with dacFLP and GMR-FLP, respectively. R7 and R8 terminals (labeled with mAb 24B10) are shown in purple. CadNM19 and CadNΔ14 (not shown) phenotypes are indistinguishable from CadNM19 on the level of individual cells. Layer choice of lamina neurons mutant for Dlar was wild-type (L5 is shown as an example). Arrow in R7 panel points to the gap in the R7 layer of the column with the mutant R7. L1 and L2 images are of late pupal stages (> 80 hrs APF). All others show adult cells. For quantification of phenotypes, see Table 1. (D) CadN is required for tiling of L5 terminals in M5. Confocal images (top) show L5 MARCM clones (green) and R7 axons (purple) in cross-sections of the M5 layer at 90 hrs APF. The cartoon on the right illustrates the grouping of L1–L5, R7 and R8 terminals into columns. In the schematic (bottom) wild-type L5s are grey and one wild type (left) or mutant cell (right) is green. Wild-type L5 terminals tile the M5 layer with little overlap of L5 processes from adjacent columns whereas CadN mutant L5s extend past column boundaries. Scale bars, 5 μm.

