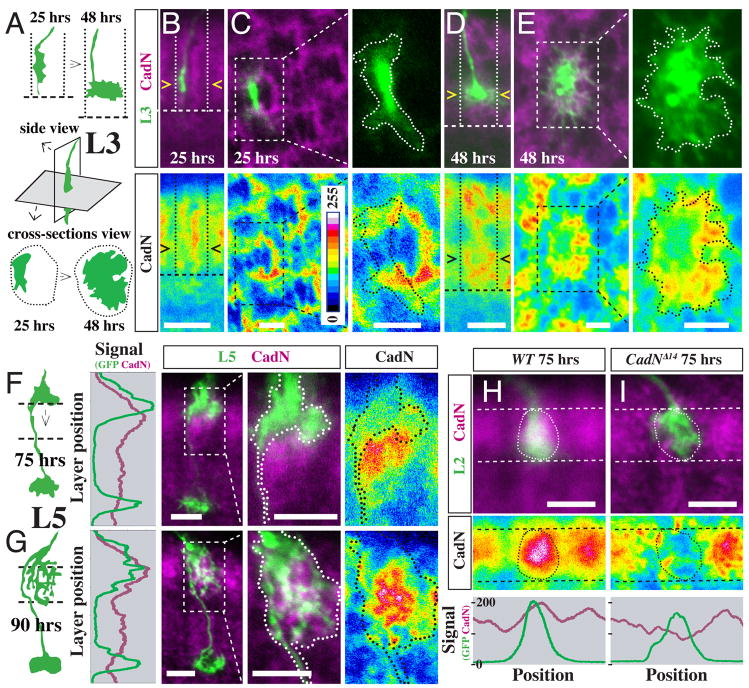
Figure 3. Local patterns of CadN protein expression correlate with CadN-dependent steps in L3 and L5 targeting.
(A–E) Asymmetric CadN expression precedes lateral L3 growth cone expansion in the developing M3 layer. (A) Schematic of wild-type L3 growth cone position and shape at 25 and 48 hrs APF in lateral and cross section views. Dotted lines, column boundaries; dashed lines, the R7 layer. (B–E) CadN protein (purple [upper panels] or pseudocolor [lower panels]) and position of L3 growth cones (green [upper panels]) at 25 hrs APF (B,C) and 48 hrs APF (D,E) APF. Confocal images show side views (B,D) or column cross sections (C,E). L3 growth cones are outlined in higher magnification views in (C,E). L3s and L5s (see below) were labeled by MARCM as in Figure 2. (F,G) Strong CadN protein expression in M2 precedes directed extension of L5 interstitial branches into this layer. Schematics, graphs and confocal images of L5s and CadN patterns before (F, 75 hrs APF) and after (G, 90 hrs APF) branch extension into M2. For the graph, CadN (purple) and GFP (green) channel signals were averaged across the column. (H,I) CadN expression on L2 growth cones at 75 hrs APF. MARCM clones of wild-type (H) and CadNΔ14 mutant (I) L2 terminals (green, circled) and CadN protein in the M2 layer (dashed lines) are shown. Graphs show the average CadN (purple) and GFP (green) signals between the dashed lines. Scale bars, 5 μm (B,D,F,G,H,I) or 2.5 μm (C,E). Intensity scale in (B) applies to all pseudocolor images.

