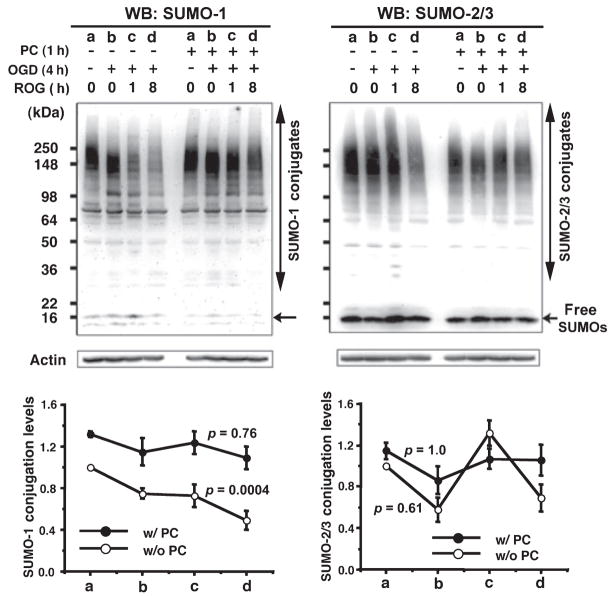
Fig. 3.
SUMO-1 and SUMO-2/3 conjugation levels in rat cortical neurons during ROG after a harmful OGD. SUMO-1 (left panel) and SUMO-2/3 (right panel) protein levels were analyzed in the total cell extracts from rat cortical neurons treated as follows with or without PC: a, control; b, OGD 4 h; c, OGD 4 h followed by 1 h ROG; d, OGD 4 h followed by 8 h ROG. Upper panels are representative PAGE/WB pictures and lower panels are quantitative analyses of the densities of conjugates and free forms. Open circles designate without PC and filled circles designate with PC. Data are shown as means ± SD (n = 3). Jonckheere-Terpstra tests were applied in order to analyze trends in SUMOylation levels during OGD. p values are indicated on the figure.

