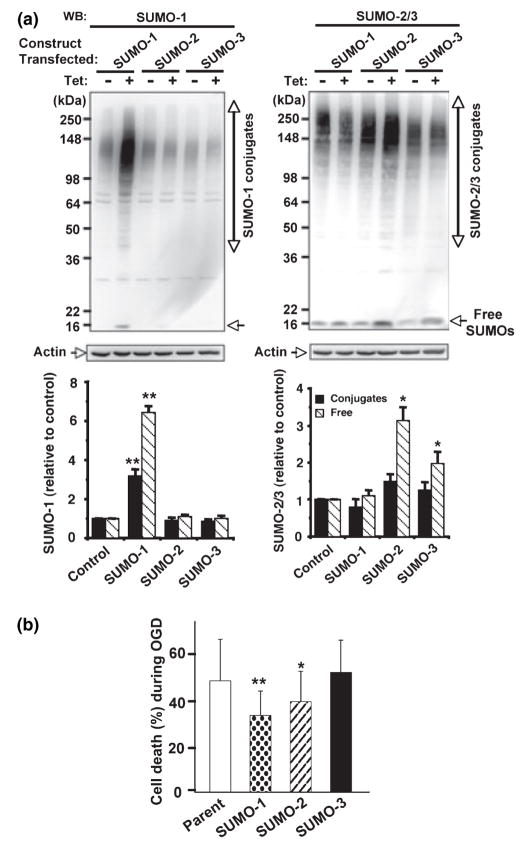
Fig. 4.
Over-expression of SUMO-1 and SUMO-2 made SHSY5Y cells more resistant to OGD. (a) SUMO-1 (left panel) and SUMO-2/3 (right panel) protein levels were analyzed in total cell extracts from stable SUMO-1, -2 or -3 transfectants grown in the presence (+) or the absence (−) of tetracycline (1 μM). Upper panels are representative PAGE/WB pictures and lower panels are quantitative analyses of densities of conjugates (solid bars) and free forms (striped bars). Data are shown as means ± SD (n = 4). **p < 0.01, *p < 0.05 compared with endogenous levels. (b) The three transfectants along with their parent cells were subjected to OGD (12 h) in the presence of tetracycline, and cell deaths during OGD (without ROG) were measured by nuclear staining with Hoechst 33342 and PI followed by FACS analysis. Data are shown as means ± SD (n = 6). **p < 0.01, *p < 0.05 compared with parent cells.

