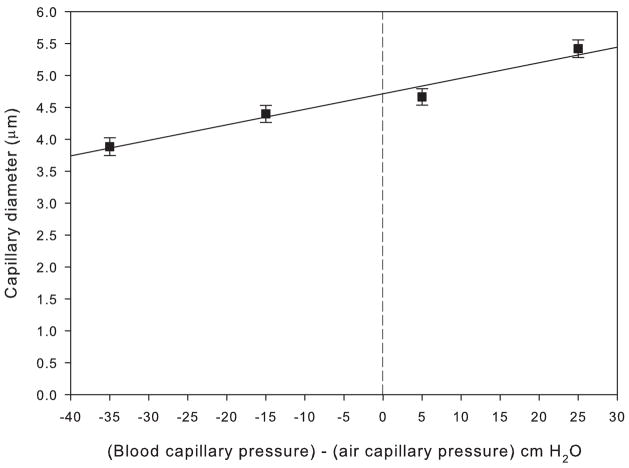
Figure 2.
Plot of pulmonary capillary diameter (μm) vs. (blood capillary pressure) – (air capillary pressure) (cm H2O) with a fitted least-squares regression line for the chicken pulmonary capillaries. The four points correspond to the four rows in Table 1.

