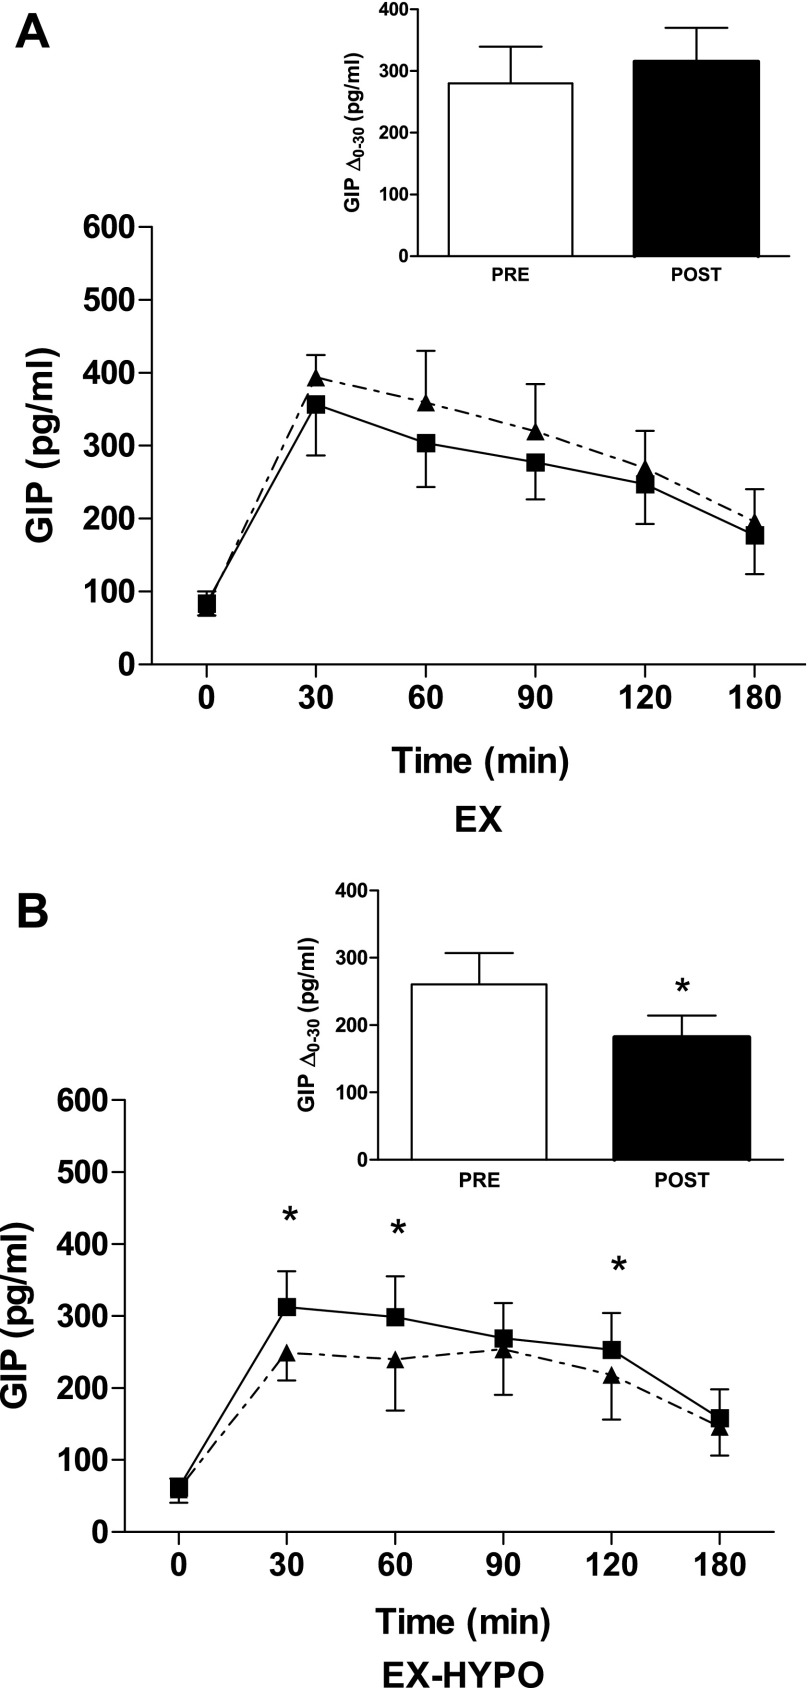
Fig. 2.
Plasma glucose-dependent insulinotropic polypeptide (GIP) responses to a 75-g oral glucose challenge. The GIP response to a 75-g oral glucose stimulus was measured before and after the EX (A) and EX-HYPO (B) interventions. The solid lines represent prestudy GIP responses to the oral glucose tolerance test (0–180 min), whereas dashed lines indicate poststudy responses. There was a significant decrease in the GIP response at t = 30, 60, and 120 min in the EX-HYPO group only; *P < 0.05. A and B, insets: immediate GIP secretory response to glucose ingestion, calculated as the change from t = 0 to 30 min (Δ0–30 min). Bars (white, pre; black, post) represent means ± SE. The GIP response was unchanged in the EX group (A, inset; pre vs. post: P > 0.05, n = 9), whereas there was a significant decrease in the EX-HYPO group (B, inset; pre vs. post: P = 0.04, n = 8).

