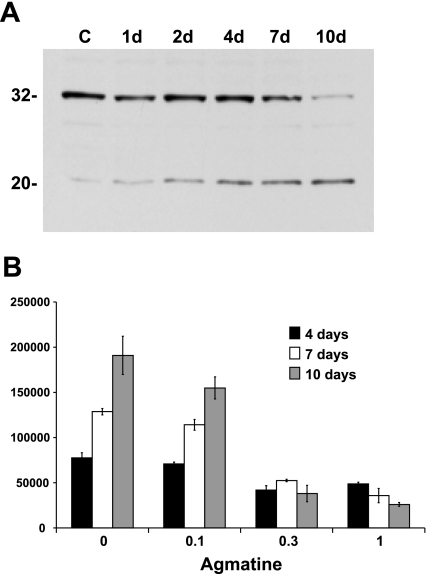
Fig. 6.
Caspase-3 expression and activity. A: Western blot analysis of caspase-3 expression in response to 500 μM AGM over the days indicated. Caspase-3 (∼32 kDa) expression decreased over time with an increase in the potential cleavage product (∼20 kDa). C, control. B: activity of the enzyme decreased in a concentration-dependent manner over time. Activity is expressed in relative units per milligram of protein per 90 min. P ≤ 0.05, AGM relative to non-AGM samples at 0.1 mM for days 4 and 10 and at 0.3 and 1.0 mM for days 4, 7, and 10.

