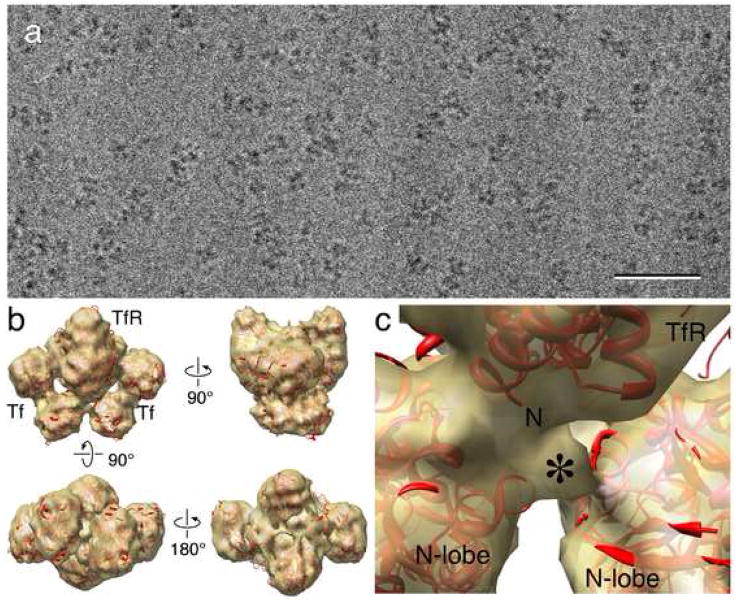
Fig. 2.
Cryo-electron microscopy of the Tf-TfR(stalk) complex. (a) Raw image of Tf-TfR(stalk) complex in vitrified ice. Scale bar is 50 nm. (b) Four views of the density map of the Tf-TfR(stalk) complex (gold) with the fit atomic model of the complex (red). (c) Close-up view of the density (asterisk) that may represent the beginning of the TfR stalk. The “N” indicates the beginning of the stalk-less construct used to determine the crystal structure of TfR.

