
Figure 1. Analysis of ts(G)114 RNA synthesis at 31°C and 39°C.
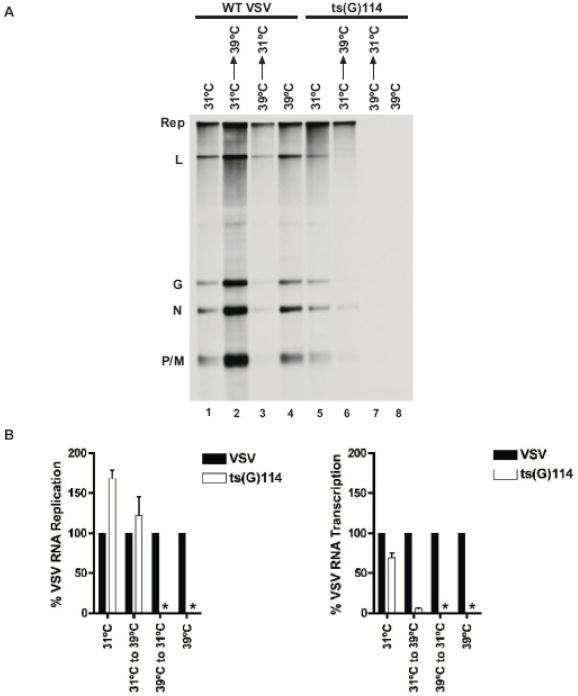
(A) BHK cells were infected at a MOI of 3 at 31°C or 39°C. At 4 hpi, infected cells were pre-treated with actinomycin-D and either maintained at 31°C, shifted from 31°C to 39°C, shifted from 39°C to 31°C, or maintained at 39°C for 30 minutes, at which time RNAs were labeled metabolically with [3H]-uridine at the same temperature as during the pre-treatment period. Radiolabeled RNAs were visualized by acid agarose-urea gel electrophoresis and fluorography. The virus infection from whence the RNAs were generated is noted above the gel along with the temperature conditions. The identities of viral RNAs are noted to the left of the gel. (B) Quantitative analysis of three independent experiments is shown in the graph. The graph on the left represents total viral RNA replication expressed as a percentage of WT at the same temperature. The graph on the right represents total viral transcription expressed as a percentage of WT at the same temperature. (*) indicates no RNA was detected.