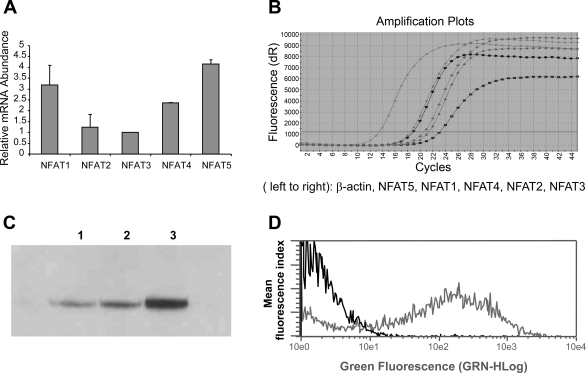
Fig. 2.
Relative expression of NFAT isoforms in the mTAL. Relative expression (A) and amplification plots (B) of NFAT isoforms in mTAL cells. Values are means ± SD of measurements from 3 independent experiments. C: expression of NFAT5 protein was measured in nuclear protein extracts from mTAL tubules (lane 1), primary mTAL cells (lane 2), and mTAL cells transfected with pcDNA3.1-NFAT5 (lane 3). D: flow cytometric assessment of transfection efficiency (>60%) in mTAL cells.

