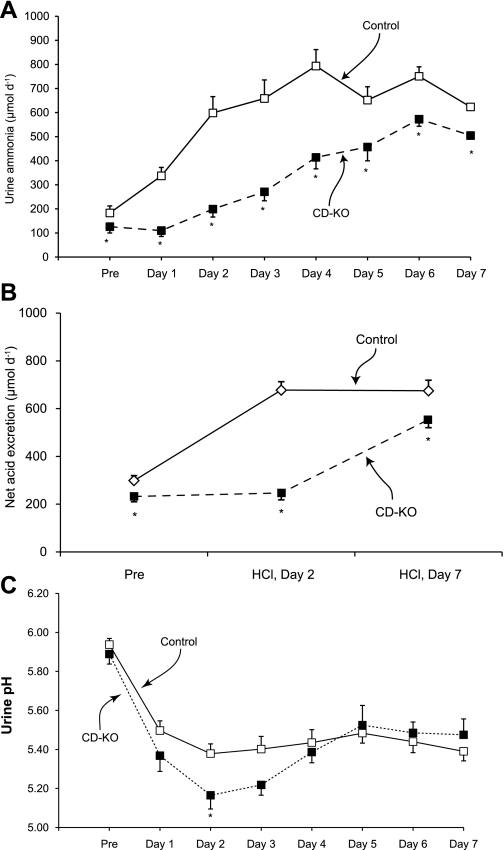
Fig. 5.
Urinary ammonia excretion, net acid excretion, and urine pH in response to HCl-induced metabolic acidosis. Mice were housed in metabolic cages, and urine was collected daily under mineral oil. A: urinary ammonia excretion. While on a control diet, urinary ammonia excretion was significantly less in CD-KO than in C mice. After addition of HCl to their chow, urinary ammonia excretion increased significantly on the first day in C mice and continued to increase to a maximum on day 4. In CD-KO mice, urinary ammonia excretion did not change significantly on the first day of acid loading, did not peak until day 6, and remained less than in C mice every day. B: net acid excretion. Before acid loading and on days 2 and 7 of acid loading, net acid excretion was significantly less in CD-KO mice than in C mice. C: changes in urine pH in response to acid loading. Acid loading induced increased urine acidification in both CD-KO and C mice that was persistent throughout the course of the study, Except at day 2 of acid loading, there was no significant difference in urine pH. *P < 0.05 vs. C.

