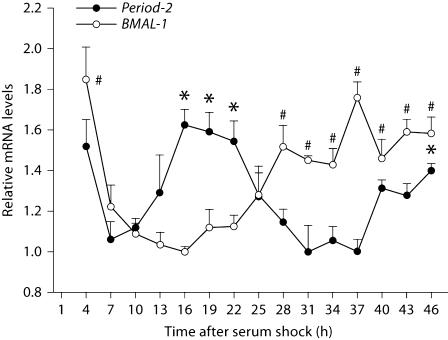
Fig. 1.
Mouse Period-2 and BMAL-1 expression exhibit a daily pattern in GT1–7 cells. Fluctuations in mRNA levels after serum shock were quantified by real-time PCR and normalized to mouse β-actin mRNA. Average gene expression is shown as a percentage of the minimal expression during the day. Error bars represent standard errors (n = 3). Mouse Period-2 (F14, 44 = 13.407, p < 0.001) and BMAL-1 (F14, 44 = 18.634, p < 0.001) mRNA levels exhibit a ∼24-hour pattern in anti-phase to each other. ∗ Significantly greater Period-2 expression than the lowest value over the course of the sampling period: p < 0.05. # Significantly greater BMAL-1 expression than the lowest value over the course of the sampling period: p < 0.05.

