
Fig. 3. TNF-α production is not induced by the disruption of cytoskeleton.
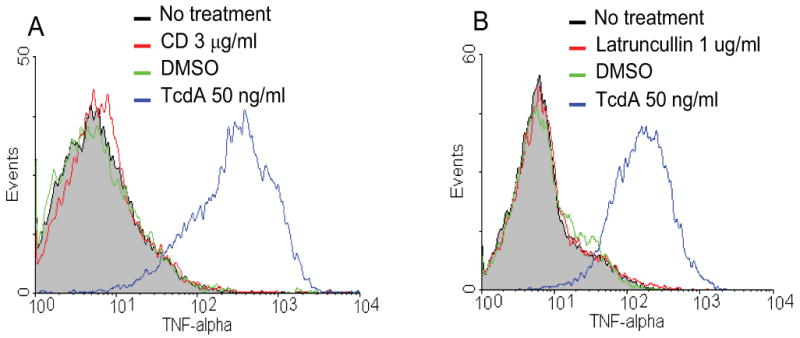
RAW 264.7 cells were incubated with cytochalasin-D (CD) at 3 μg/ml (A, red line) or latrunculin B at 1 μg/ml (B, red line) at 37°C for 6 h. Control groups include no treatment (grey line), DMSO (vehicle, green line) or TcdA (50 ng/ml, blue line). Cells were harvested and TNF-α was determined by flow cytometry analysis.