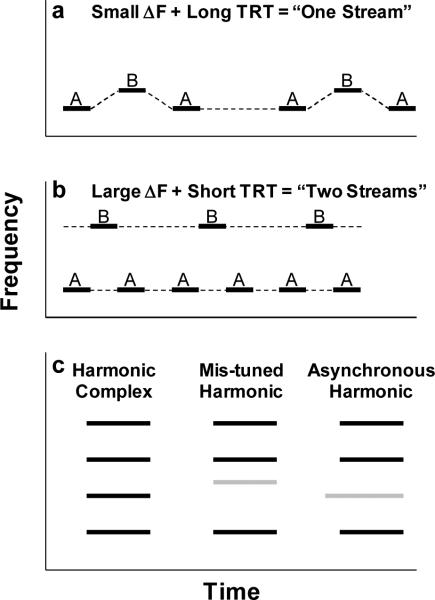
Figure 2.
Schematic spectrograms illustrating experimental stimuli for investigating auditory streaming and simultaneous integration/segregation. a. An “ABA–ABA–...” tone sequence with a small difference in frequency (ΔF) between the A and B tones and a long tone repetition time (TRT); such a sequence would be perceived as a single, integrated stream of alternating tones with a galloping rhythm. b. An “ABA–ABA–...” tone sequence with a large ΔF and a short TRT; such a sequence would be perceived as two segregated streams, each with an isochronous rhythm. The dashed lines in a and b indicate the percept (one versus two streams, respectively). c. Three harmonic tone complexes showing a “normal” tone complex (left), a tone complex with a mistuned second harmonic (middle), and a tone complex with an asynchronous second harmonic that begins earlier than other the harmonics. In the later two cases, the second harmonic would likely be segregated from the rest of the integrated tone complex.

