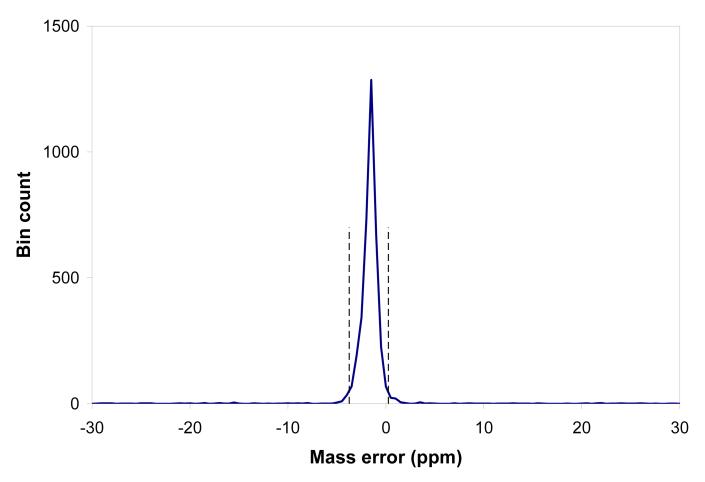
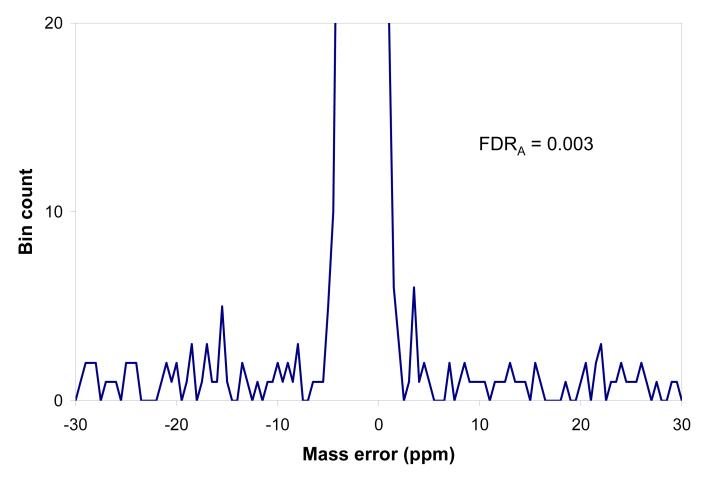
Figure 4.
The histogram of mass residuals between precursor masses found in the high resolution precursor MS spectra and theoretical masses calculated for peptides produced by the SEQUEST search based upon the linear ion trap MS/MS spectra, obtained as a result of the accurate precursor mass filter (APMF) analysis. a). The histogram peak area corresponds to 3577 peptides passing tolerance range from -3.75 to 0.25 ppm, vertical segments b). Y-scale expanded to show the level of matches outside the range of mass measurement accuracy, |dM| > 10 ppm, on average 1.5 counts per 0.5 ppm bin, corresponding to 12 false positive identifications per 8 ppm tolerance range, FDRA ∼ 0.003.


