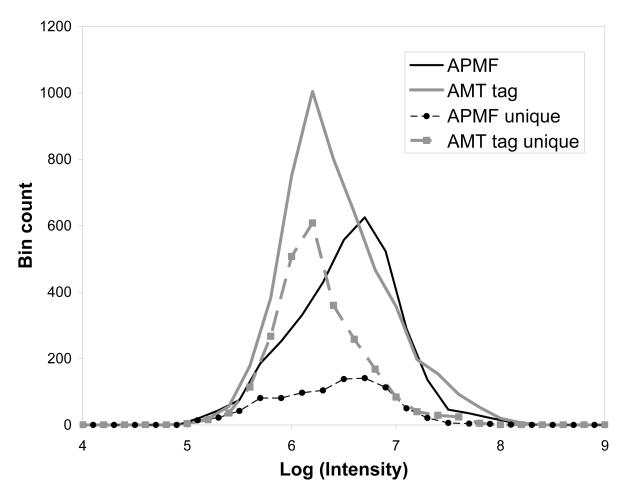
Figure 5.
Intensity distribution of Shewanella oneidensis peptides identified from accurate mass FTMS spectra and low resolution LIT MS/MS spectra of the same LC-MS run using LTQ-Orbitrap. Horizontal axis: ion intensity, common logarithm; vertical axis: number of identifications per 0.2 bin. Black solid line: MS/MS identifications filtered using APMF; gray solid line: AMT tag identifications from the accurate mass full MS Orbitrap spectra; circles: peptides identified by APMF and not identified by AMT tag; squares: peptides identified by AMT tag and not identified by APMF.

