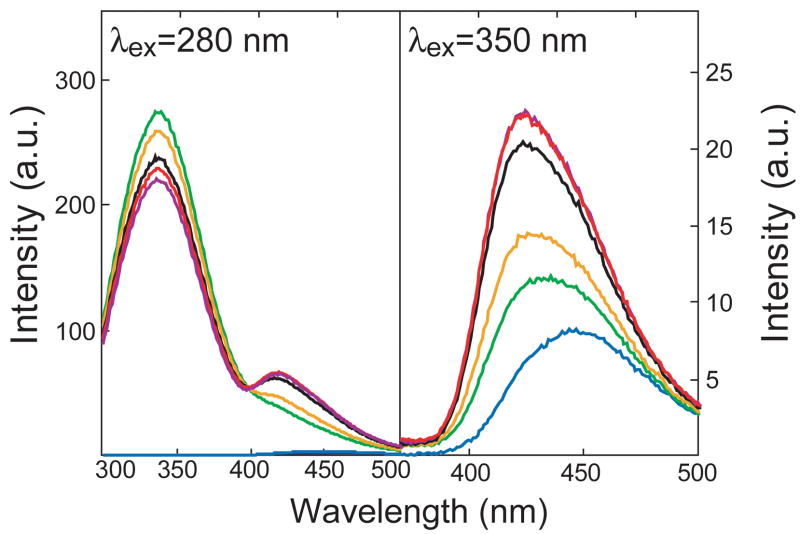
Fig. 3. Cumulative concentration/response curves for the effects of FS on FRET and direct MANT-GTP fluorescence in C1/C2.
Fluorescence studies were performed as described in “Materials and Methods”. Fluorescence spectra are shown at λex= 280 nm (λem = 300–500 nm, left-hand graph) (FRET) and at λex = 350 nm (λem = 370–500 nm) (direct fluorescence, right-hand graph). Fluorescence measurements were performed in a quartz florescence microcuvette at 25°C. Reaction mixtures contained 100 mM KCl, 10 mM MnCl2 and 25 mM HEPES/NaOH, pH 7.4 and MANT-GTP (1 μM). The final assay volume was 150 μl and the final DMSO concentration was 3% (vol/vol). FS was added cumulatively to cuvettes to yield final concentrations of 1–151 μM. The C1 and C2 concentrations were 5 and 25 μM, respectively. Tracings are defined as follows. Blue, MANT-GTP; green, C1/C2; yellow, 1 μM FS; black, 11 μM FS; purple, 31 μM FS; red, 151 μM FS. Fluorescence intensities are shown in arbitrary units (a. u.). Fluorescence tracings are representative for three independent experiments.

