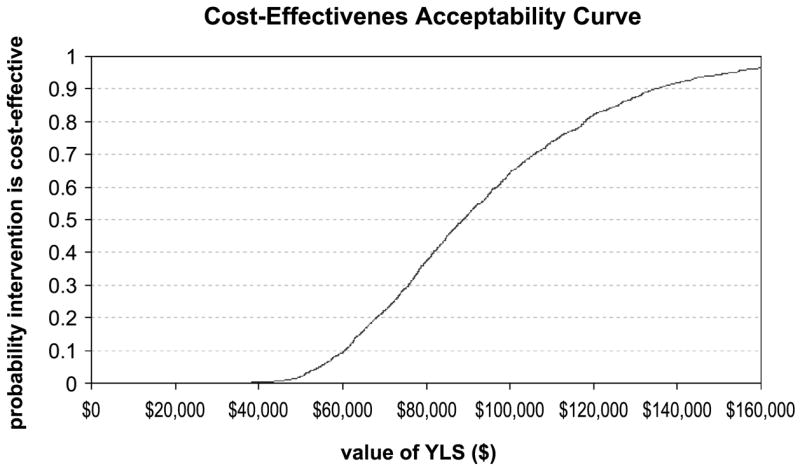
Figure 4.

Cost-effectiveness acceptability curve for family history assessment. Probability that family history assessment is associated with a cost per life year gained that is lower than the corresponding cost-effectiveness ratios (x-axis). The value of the ceiling ratio at a probability of 0.5 is the expected cost per quality-adjusted life years for family history assessment.
