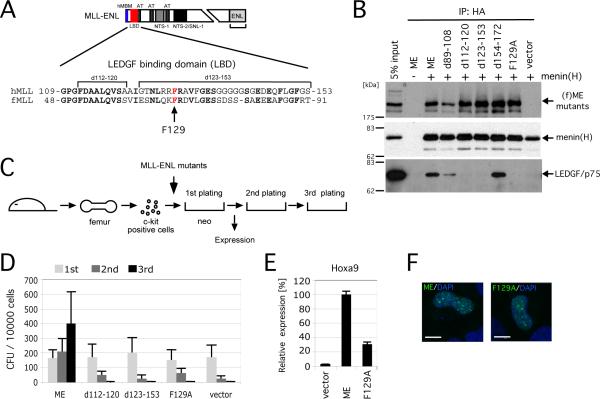
Figure 3. MLL oncoproteins associate with LEDGF to initiate myeloid transformation.
A. Schematic structure of the MLL-ENL oncoprotein. Amino acid sequence of MLL encompassing the LEDGF binding domain (LBD, residues 109-153 denoted by red box) is aligned with that of fugu MLL. Arrow indicates the phenylalanine residue substituted to alanine.
B. Various mutants of (f)ME were transiently expressed with (+) or without (-) HA-tagged menin in 293T cells and subjected to IP with anti-HA antibody followed by immunoblotting with anti-FLAG, anti-HA, and anti-LEDGF antibodies.
C. The experimental scheme for myeloid progenitor transformation assay. The time point at which Hoxa9 expression was measured (end of 1st plating) is indicated.
D. The colony forming units (CFU) per 104 plated cells are shown for each round of plating. Error bars represent standard deviations of three independent experiments.
E. Relative expression levels of Hoxa9 are shown for first round colonies. Expression levels are normalized to β-actin and expressed relative to the ME value (arbitrarily set at 100%). Error bars represent standard deviations of triplicate PCR analyses.
F. Subnuclear localizations of MLL fusion proteins in HeLa cells are shown as a merged image of signals for FITC (MLL) and DAPI (DNA). Scale bar, 10 μm.

