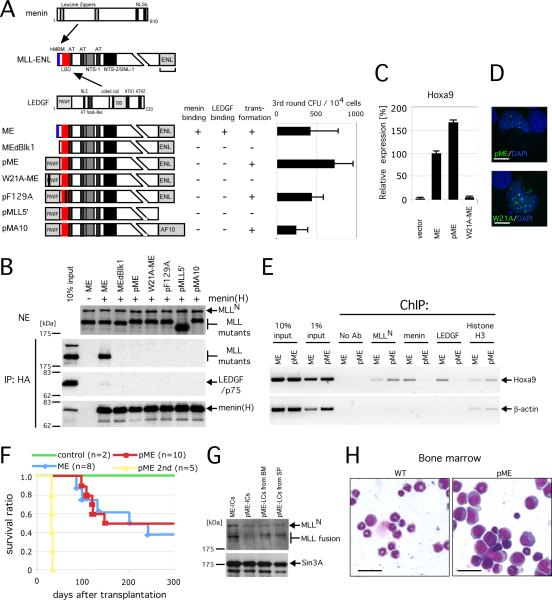
Figure 4. Menin tethers LEDGF with MLL oncoproteins.
A. Schematic structures of menin, MLL-ENL and LEDGF are shown at the top with sites of intermolecular interactions indicated by arrows. Binding properties and transforming abilities are summarized to the right of the respective MLL-ENL constructs. The numbers of 3rd round CFU in myeloid progenitor assays are shown with error bars representing the standard deviations of three independent experiments.
B. Various mutants of pME were transiently expressed with (+) or without (-) HA-tagged menin in 293T cells and subjected to IP with anti-HA antibody followed by immunoblotting with anti-MLLN, anti-HA, and anti-LEDGF antibodies. Upper panel shows immunoblot of the nuclear extracts (NE) to determine protein inputs. Mutants lacking the hMBM failed to co-IP with menin and LEDGF.
C. The relative expression levels are shown for Hoxa9 in first round colonies. Expression levels are normalized to β-Actin, and expressed relative to the ME value (arbitrarily set at 100%). Error bars represent standard deviations of triplicate PCR analyses.
D. Subnuclear localization of the pME mutants in HeLa cells is shown as a merged image of signals for FITC (MLL) and DAPI (DNA). Scale bar, 10 μm.
E. ChIP analysis of ME- or pME-transformed myeloid progenitors was performed using antibodies indicated at the top. Amplicons upstream of Hoxa9 and β-Actin genes were analyzed.
F. Survival curves are shown for mice transplanted with the indicated transduced cells. Numbers of mice analyzed (n) are shown.
G. Expression of ME and pME proteins in immortalized cells (IC) and leukemic cells (LC) from bone marrow (BM) and spleen (SP) were analyzed by immunoblotting with anti-MLLN and anti-SIN3A (control) antibodies.
H. Morphology is shown for pME leukemic blasts (pME: right panel) and normal BM (wt: left) following May-Grunwald/Giemsa staining of cytospin preparations. Scale bar, 15 μm.

