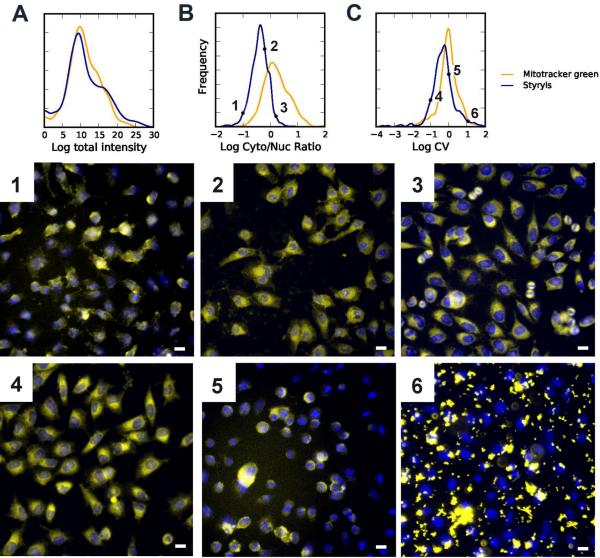
Figure 1.
The distributions of whole cell intensity (A), cytoplasmic to nuclear ratio (B), and whole cell coefficient of variation (C), along with representative images (1-6) from various points along each distribution. All images are composites acquired from the Hoechst™ (blue) and TRITC channel (yellow, 1s exposure in the presence of extracellular dye). Scale bar = 10 μm.

