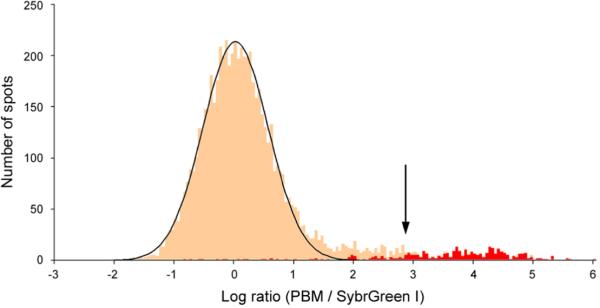
Figure 2. Identifying the specifically bound spots.
(a) Distribution of Rap1 PBM ratio (PBM / SybrGreen I) data. The arrow indicates those spots passing a P value threshold of 0.001 after correction for multiple hypothesis testing. Indicated in red are spots harboring an exact match to a sequence belonging to our discovered Rap1 binding site motif. (b) Zoom-in on intergenic regions, from both PBMs (left) and SybrGreen I stained microarrays (right), upstream of RPL14A, RPL8A, and OPI3, which are known direct targets of Rap1. The fluorescence intensities of the spots are shown in false-color, color-coded as described previously (Fig. 1 legend). PBM P values are corrected for multiple hypotheses. Determination of binding in ChIP-chip experiments (“YES” or “NO”) is described in Methods. All regions shown have an exact match to a sequence belonging to the discovered Rap1 motif (“YES”). For each region, the binding site is conserved across five sensu stricto yeast strains either to within two standard deviations (“2 SD”) or 100% identical at each position (“Exact”) as described in Methods. “*” indicates Rap1 ChIP-chip data from Lee et al.6, and “#” indicates Rap1 ChIP-chip data from Lieb et al.5.


