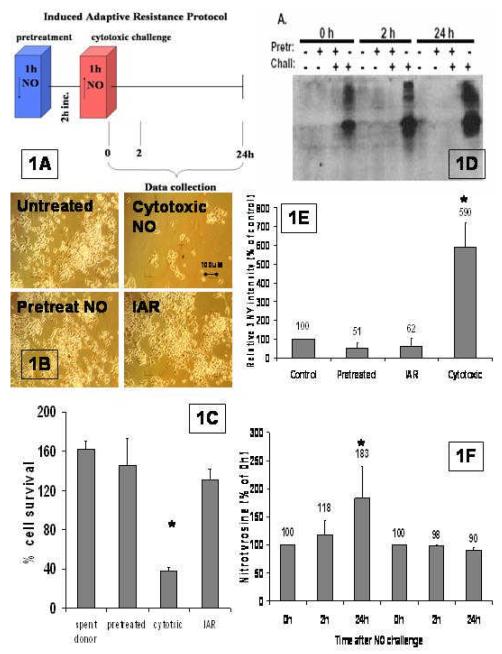
Fig. 1. Induced adaptive resistance.
A.) Diagram of NO treatment protocol for IAR. Cells are pretreated with low dose of NO (2pmoles/s) for 1 hour (PT), incubated for 2 hours and then treated with the cytotoxic dose of NO (∼110pmoles/s) (CT) after which cells are assayed for acquired NO resistance (IAR). B.) Demonstration of IAR. UT = Non-pretreated and non-challenged cells, PT = NO-pretreated cells not challenged, CT = Non-pretreated cells challenged with NO, IAR = NO-pretreated cells challenged with NO. Photos at 100X mag. C) Cell survival after 24 hours. Cells were plated evenly and the number of cells 24h after the treatment was divided by the cells in that same well right before treatment to normalize for any unintended differences between each well. For all samples standard error of the mean was calculated. The IAR group was compared to the CT group with an asterisk designating a significance of P<.01.D). Western blot probed for nitrotyrosine. The protein extracts were isolated from cells that were untreated--those treated with spent NO donor [with (–) in both rows)], pretreated with low dose NO (∼2pmoles/s) [with (+) in pretreated row and (–) in challenge row ], or pretreated incubated then NO challenged (∼110pmoles/s) [IAR cells adapted with (+) in both rows], or challenged with high NO dose alone (∼110pmoles/s) [cytotoxic with (–) in pretreated row and (+) in challenged row], and assayed 0hrs,2hrs,24hrs after completion of treatment protocol. In these experiments we ran the westerns for a very short time for convenience. E). Quantification of densitometry. Densitometry values were divided by amount of protein loaded or band intensity of Ponceau staining-both of which were equal in all lanes. The four treatment groups are untreated (UT), pretreated (pretreated), IAR (adapted), and cytotoxic levels of NO (cytotoxic) at 24hrs. This was done for multiple experiments (n=6), averaged and an SEM was calculated. The 3NY levels in the CT and IAR group was compared, and significance of (p<.01) was designated by an asterisk. F). 3NY increase over 24h. Quantification by densitometry was measured for 24 hours post treatment to assay long term disposition of 3NY levels in the cell. SEM was calculated, the difference between each time point and 0h was calculated, and the significance determined (p<.05) and designated by an asterisk.

