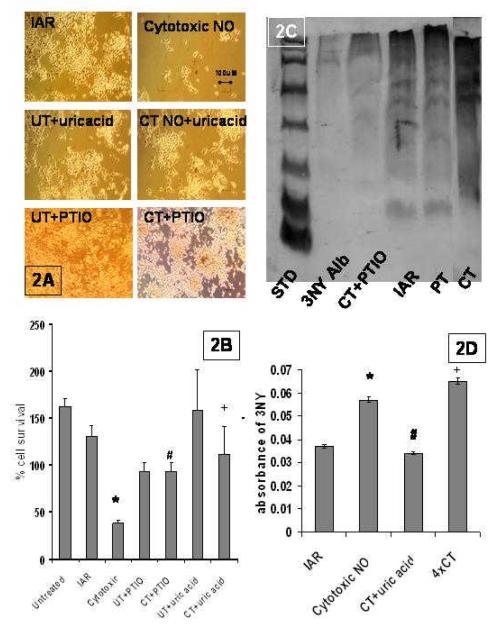
Figure 2. PTIO and uric acid mitigates NO toxicity.
A. IAR with peroxynitrite inhibitors: IAR are cells pretreated for 60 min with ∼2pmols/sec NO, incubated 2h to allow gene expression and challenged with ∼110pmols/sec NO for 60 min.; CT is non-pretreated cells, challenged with cytotoxic levels of NO (∼110pmols/sec NO for 60 min.); UT + UA were cells treated with uric acid alone; CT + UA are cells pretreated with uric acid and then challenged with cytotoxic doses of NO (∼110pmols/sec NO for 60 min.); UT + PTIO are control cells treated with PTIO alone; and CT + PTIO are cells pretreated with PTIO before being challenged with cytotoxic doses of NO (micrographs at 100x mag). B. % cell survival 24 hours after treatment. The values are the mean + SEM of 6 experiments performed in duplicate and a comparison between the CT group and IAR group was made and determined to be significant (p<.001) designated by an asterisk. A comparison between CT and CT+PTIO was determined and significance (p<.001) was designated by a #. CT vs CT+Uric acid (p<.01) was designated by a +. C. Western blots probed for nitrotyrosine. The bands were all 3NY positive, so the entire lane was taken into account for the densitometry in gels where equal loading of proteins has been assured by Ponceau staining or by Biorad assay. D. ELISA assays: ELISAs were run on cell extracts and were probed for 3NY content. Absorbance values subtracting controls for background were graphed. IAR vs CT was compared and found to be significant (p<.01) and designated with an asterisk. CT vs CT +uric acid was compared and found to be significant (p<.01) and designated by a #. 4×CT were cells exposed to 4x the CTNO dose and the 3NY formation was significantly greater than that of IAR (p<.01) designated with a +.

