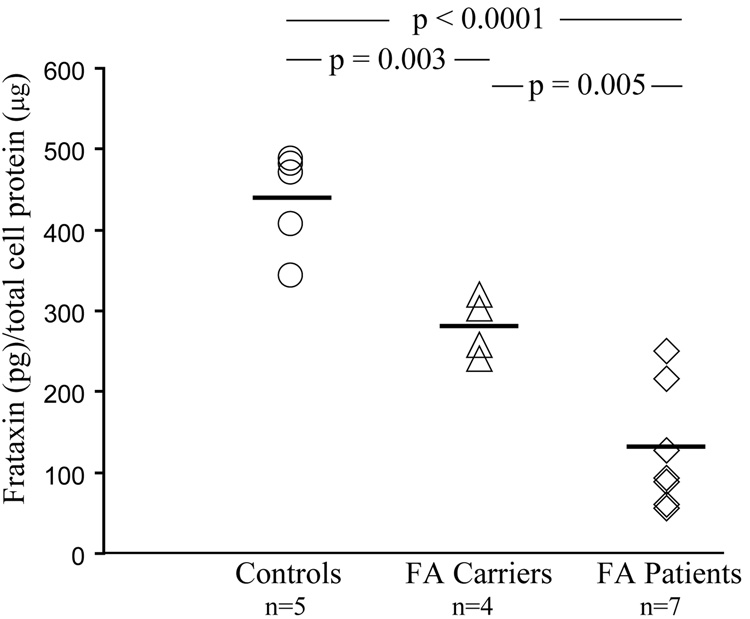
Fig. 4. Frataxin dipsticks identify FA patients and FA carriers from Controls.
Frataxin protein levels were measured in whole cell extracts from lymphoblastoid cells derived from controls (n=5), FA carriers (n=4) and FA patients (n=7). Two measurements from each sample (2 µg total cell protein per dipstick) were averaged and extrapolated from a standard curve to pico-grams (pg) of recombinant frataxin before analysis. The p values shown (Student’s t-test) were calculated for pair-wise comparisons as indicated. Solid lines indicate the mean value for each group; 100% for Controls, 64% for FA carriers and 29% for FA patients.

