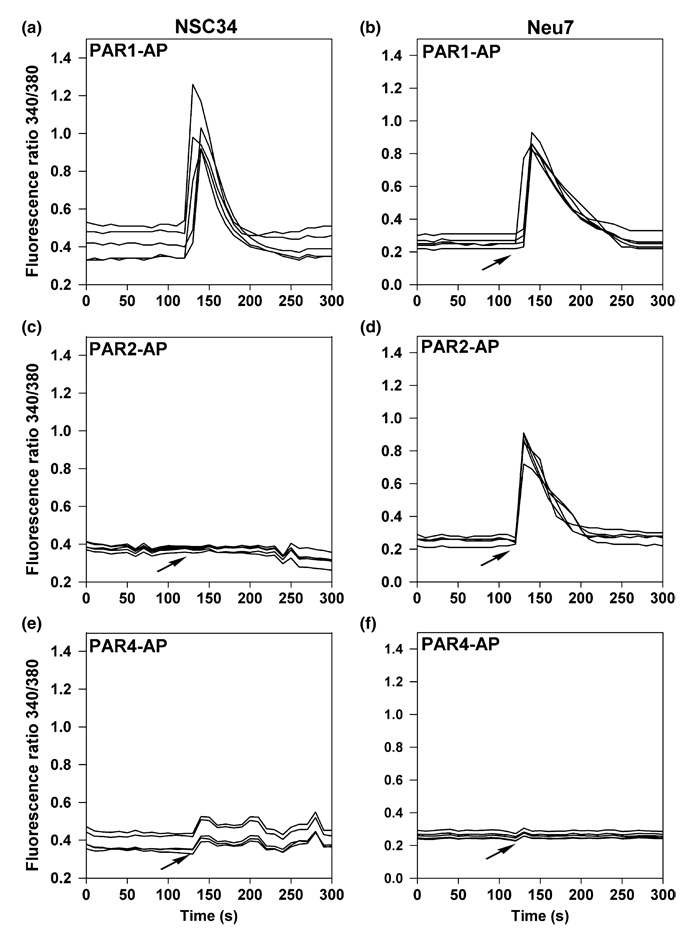
Fig. 2.
Presence of functional PARs on NSC34 neurons and Neu7 astrocytes. Representative traces from five cells show Ca2+ responses measured by changes in the fluorescence ratio (F340/F380 nm) of fura-2 loaded NSC34 neurons (a, c, and e) or Neu7 astrocytes (b, d, and f). Arrows indicate the time of agonist application. (a) NSC34 neurons treated with PAR1-AP (40 µM) (n = 30); (b) Neu7 astrocytes treated with PAR1-AP (40 µM) (n = 30); (c) NSC34 neurons treated with PAR2-AP (200 µM) (n = 30); (d) Neu7 astrocytes treated with PAR2-AP (200 µM) (n = 30); (e) NSC34 neurons treated with PAR4-AP (200 µM) (n = 30); (f) Neu7 astrocytes treated with PAR4-AP (200 µM) (n = 30); n indicates total number of cells quantified.

