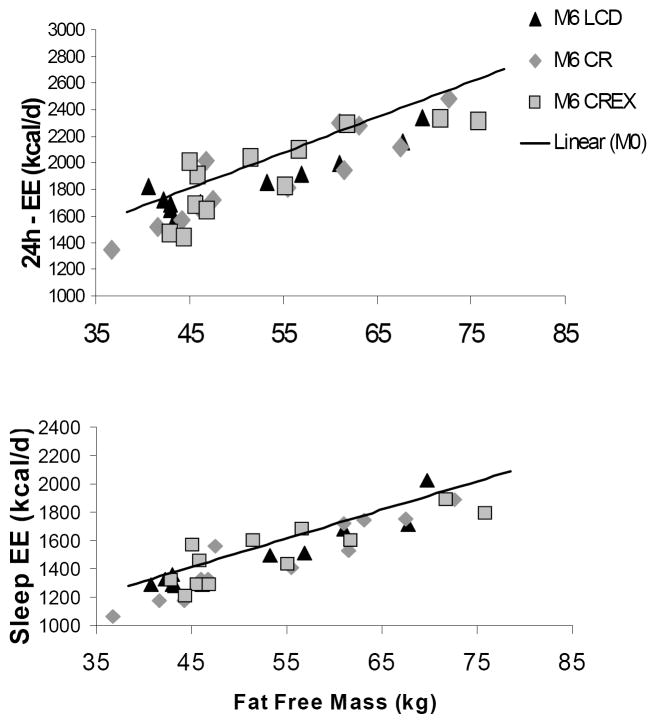
Figure 5.
Correlation between: Top panel: measured 24h-EE and fat-free mass. [24h-EE (kcal/d) = 596 + 26.8 * FFM, r2 = 0.86, p<0.001]; Bottom panel: measured sleep-EE and fat-free mass. EE [sleeping EE = 501 + 20.2 * FFM, r2 = 0.76, p<0.001]. Fat Free mass was the major determinant of sleep-EE.
Footnote: EE = energy expenditure, CR = calorie restriction, CREX = calorie restriction plus exercise, LCD = liquid calorie diet. Regression lines are drawn at baseline in all subjects (n=48) with individual’s values at M6 in CR, CREX and LCD groups.

