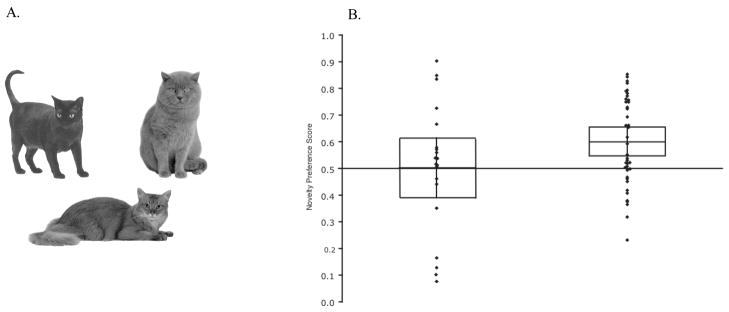
Figure 1.
A. Examples of pictures of cats used as stimuli in both experiments. B. Infant novelty preference scores (looking to the novel item divided by total looking during test) for Experiment 1 (left) and Experiment 2 (right). The box represents 95% confidence intervals; the average novelty preference score is the line bisecting the box. Each individual diamond represents the responding of a single infant.

