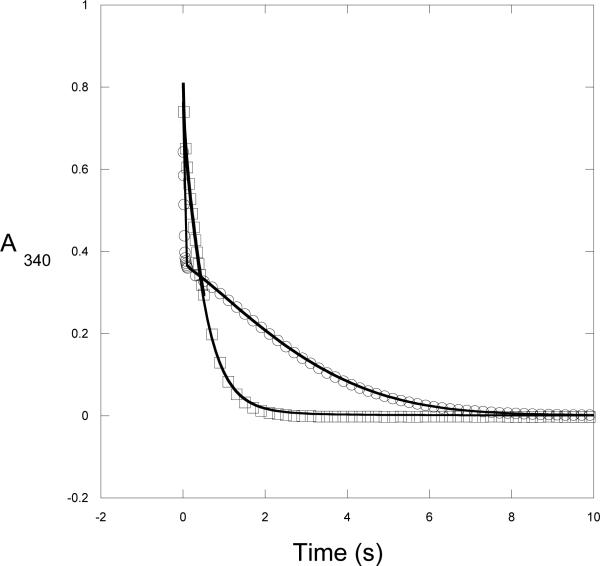
Figure 3. Time Course of M. tb Catalysis.
The conversion of NADH to NAD+ by native M. tb PGDH is monitored under conditions where substrate is depleted. Two mixing protocols where performed on a stopped flow instrument. The data are represented by symbols and the simulation to Scheme 2 is represented by a solid line. For clarity, not every data point is shown. 1) Enzyme (2.5 μM) was rapidly mixed with HPAP (1000 μM) and NADH (350 μM), Ο; 2) Enzyme (2.5 μM) and NADH (175 μM) were rapidly mixed with HPAP (1000 μM) and NADH (175 μM), □.

