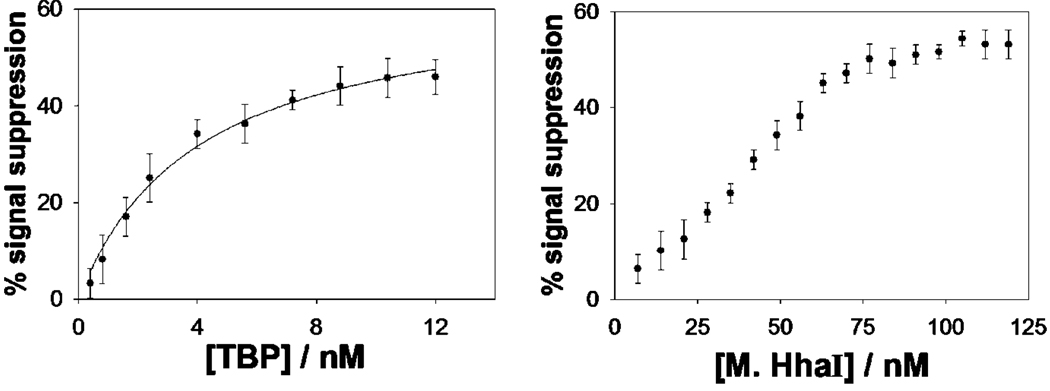
Figure 2.
Both the TBP (left) and M.HhaI (right) sensors detect their target proteins at low nanomolar concentrations. The TBP dose–response curve is hyperbolic with a dissociation constant comparable to previous literature values.30 The dose–response curve of the M.HhaI sensor, in contrast, exhibits a bilinear shape, presumably because of the low (pM) dissociation constant of this protein.31 The data points and error bars represent the average and standard deviations of measurements conducted using three independently fabricated electrodes.

