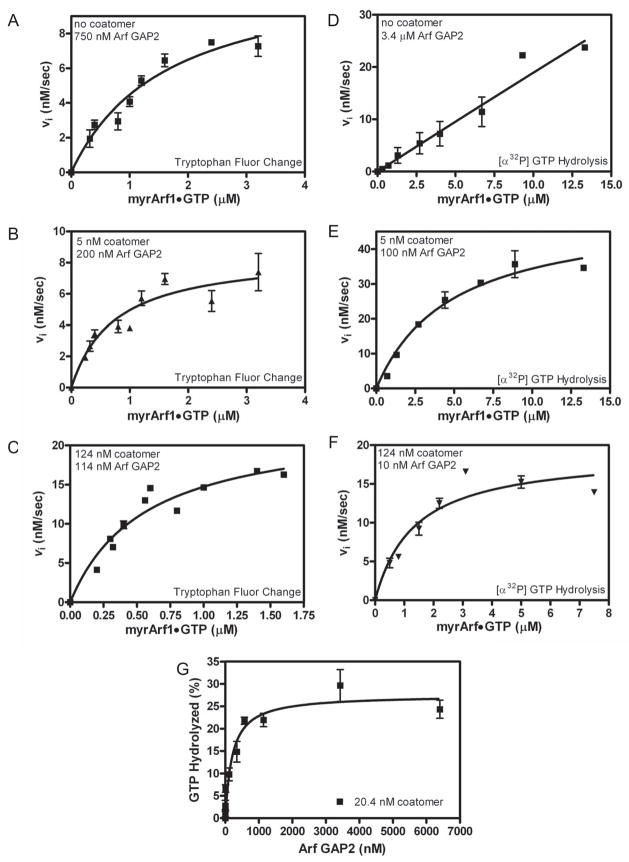
Figure 5. Effect of coatomer on kinetics of Arf GAP2-catalyzed GTP hydrolysis. Panels A – C. Saturation kinetics performed with fluorescent based assay.
The conversion of Arf1•GTP to Arf•GDP was followed using tryptophan fluorescence in a reaction containing LUVs with PI4P and extruded through 0.03 μm pores and either (A) 750 nM [1–521] Arf GAP2 His6, (B) 5 nM coatomer with 200 nM [1–521] Arf GAP2 His6 or (C) 124 nM coatomer with 114 nM [1–521] Arf GAP2 His6. Initial rates were estimated, and the plot of initial rate versus myrArf1•GTP was fit to the Michaelis-Menten equation to estimate the Km and Vmax. The Km and the kcat, calculated from the Vmax, are presented in Table 3. Panels D – F. Saturation kinetics performed following [α32P]GTP hydrolysis. [α32P]GTP•Arf1 was titrated into reactions containing LUVs with PI4P and extruded through 0.03 μm pores and either (D) 3.4 μM [1–521] Arf GAP2 His6, (E) 5 nM coatomer with 100 nM [1–521] Arf GAP2 His6 or (F) 124 nM coatomer with 10 nM [1–521] Arf GAP2 His6 as indicated. Initial rates were estimated, and the plot of initial rate versus myrArf1•GTP was fit to the Michaelis-Menten equation to estimate the Km and Vmax. The Km and kcat, calculated from the Vmax, are presented in Table 3. Panel G. Arf GAP2 concentration dependence in the presence of limiting coatomer. [1–521] Arf GAP2 His6 was titrated into a reaction containing LUVs containing PI4P and extruded through 0.03 μm pores, 0.6 μM of [α32P]GTP•myrArf1 and 20 nM coatomer. Reactions were stopped after 3 min at 30°C. Three experiments are summarized.

