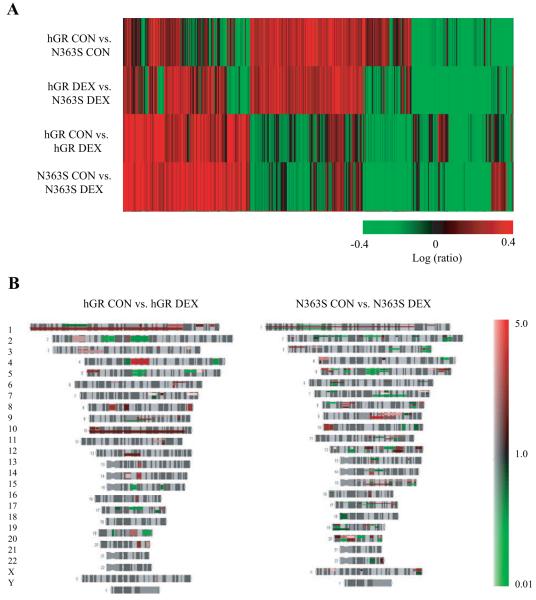
Fig. 2.
Microarray analysis of N363S. hGR-B5 and N363S-A2 cells were treated with 10 nm dexamethasone or vehicle (control) for 6 h. Total RNA was isolated and submitted for microarray analysis. Each experimental hybridization consisted of four comparison groups: hGR CON (vehicle control) vs. N363S CON; hGR DEX (treated with 10 nm dexamethasone) vs. N363S DEX; hGR CON vs. hGR DEX; and N363S CON vs. N363SDEX. The data generated were analyzed by selecting genes that were differentially regulated at P < 0.001 and common between two independent experiments. A, Cluster analysis of these common genes. Those in green are down-regulated, and those in red are up-regulated. B, Chromosome mapping.

