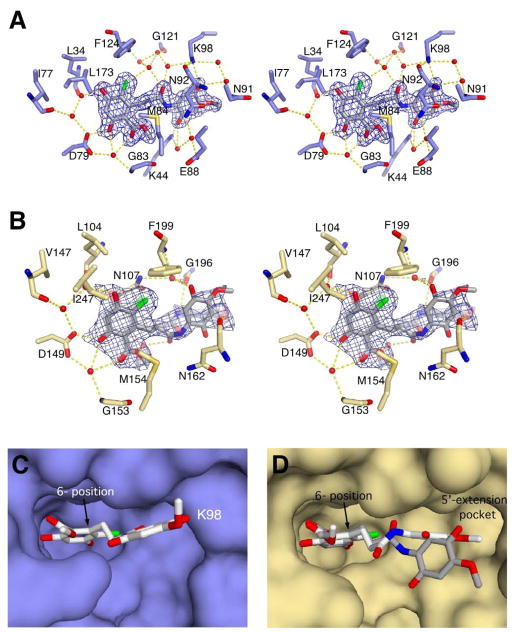
Figure 3.
Stereodiagram of the interactions between Radamide and (A) yHsp82 or (B) GRP94. Red spheres represent water molecules, and dashed yellow lines represent hydrogen bonds. In panel (B) the “vertical” orientation of the quinone is solid, and the “horizontal” orientation is semi-transparent. In both (A) and (B) the model density (2Fo-Fc model map contoured at 1.0σ carved at 1.8Å around selected atoms, blue) is displayed for the bound Radamide. The surface representations of Radamide in the ATP binding site of (C) yHsp82 and (D) GRP94 are shown to compare the orientation and trajectory of bound Radamide in the co-crystal complexes. In panel (C) Radamide makes an oblique angle with the back of the ATP binding site and extends slightly into solvent. Radamide bound to GRP94 (D) utilizes the small hydrophobic 5′-extension pocket. The two alternate conformations of Radamide (D) are colored with white carbons for the horizontal orientation of the quinone and grey carbons for the vertical orientation of the quinone.

