Figure 4.
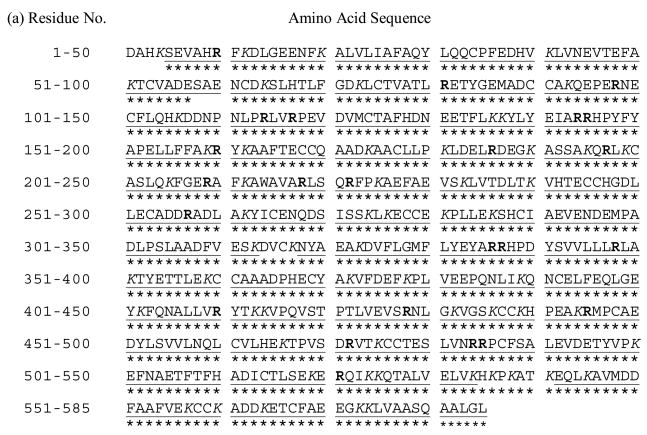
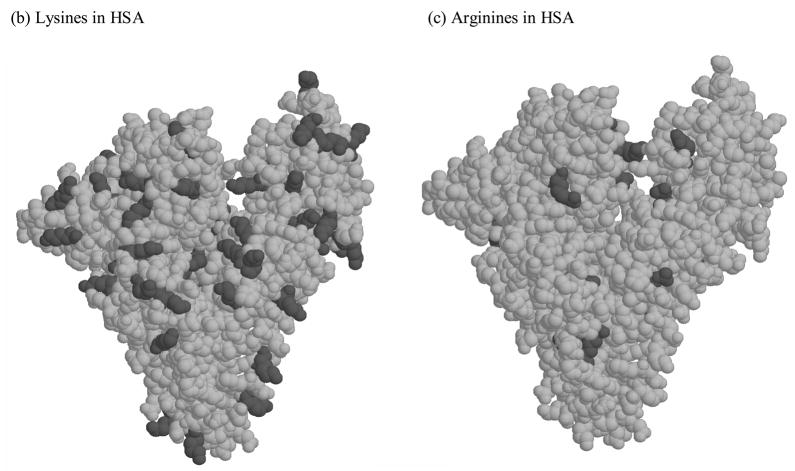
(a) Primary sequence and (b–c) crystal structure of HSA. The lysine residues (K) are given in italics in (a) and as darkened regions in (b). The arginine residues (R) are given in bold in (a) and as darkened regions in (c). The sequence in (a) shown the regions of the primary sequence that could be identified by MALDI-TOF MS for normal HSA ( ___ ) and minimally glycated HSA (***). The plots (b) and (c) are based on PDB file 1AO6.


